Immigrants from Middle Africa vs Immigrants from Argentina Female Poverty
COMPARE
Immigrants from Middle Africa
Immigrants from Argentina
Female Poverty
Female Poverty Comparison
Immigrants from Middle Africa
Immigrants from Argentina
15.2%
FEMALE POVERTY
0.5/ 100
METRIC RATING
239th/ 347
METRIC RANK
12.8%
FEMALE POVERTY
87.0/ 100
METRIC RATING
131st/ 347
METRIC RANK
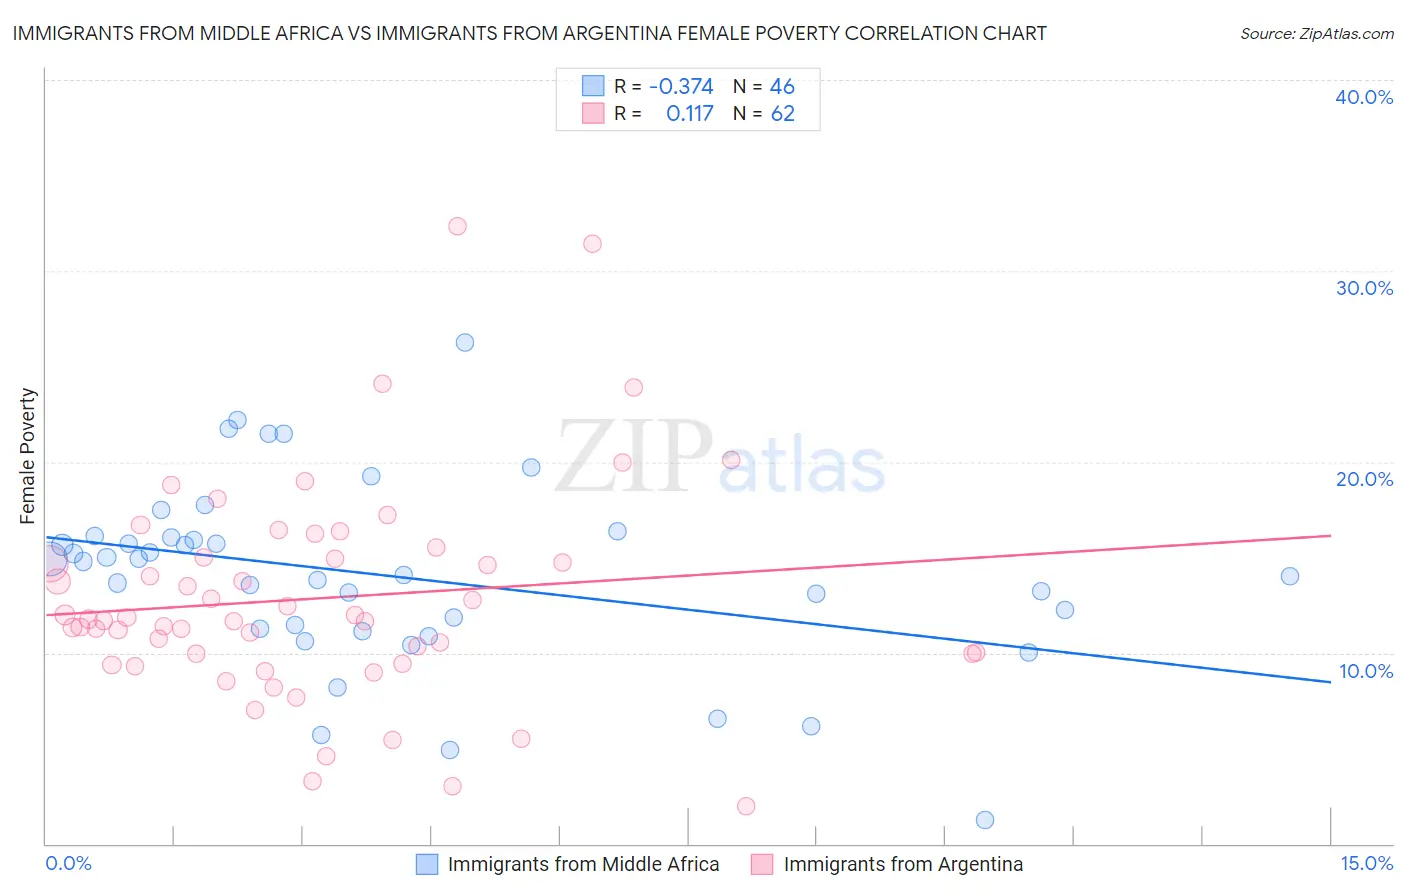
Immigrants from Middle Africa vs Immigrants from Argentina Female Poverty Correlation Chart
The statistical analysis conducted on geographies consisting of 202,623,141 people shows a mild negative correlation between the proportion of Immigrants from Middle Africa and poverty level among females in the United States with a correlation coefficient (R) of -0.374 and weighted average of 15.2%. Similarly, the statistical analysis conducted on geographies consisting of 264,332,384 people shows a poor positive correlation between the proportion of Immigrants from Argentina and poverty level among females in the United States with a correlation coefficient (R) of 0.117 and weighted average of 12.8%, a difference of 18.3%.
Female Poverty Correlation Summary
| Measurement | Immigrants from Middle Africa | Immigrants from Argentina |
| Minimum | 1.2% | 1.9% |
| Maximum | 26.2% | 32.3% |
| Range | 25.0% | 30.4% |
| Mean | 14.0% | 12.9% |
| Median | 14.4% | 11.7% |
| Interquartile 25% (IQ1) | 11.2% | 9.9% |
| Interquartile 75% (IQ3) | 16.0% | 15.0% |
| Interquartile Range (IQR) | 4.8% | 5.0% |
| Standard Deviation (Sample) | 4.9% | 5.7% |
| Standard Deviation (Population) | 4.8% | 5.7% |
Similar Demographics by Female Poverty
Demographics Similar to Immigrants from Middle Africa by Female Poverty
In terms of female poverty, the demographic groups most similar to Immigrants from Middle Africa are Sudanese (15.2%, a difference of 0.050%), Immigrants from Sudan (15.2%, a difference of 0.30%), Nepalese (15.2%, a difference of 0.42%), Immigrants from Armenia (15.1%, a difference of 0.52%), and French American Indian (15.1%, a difference of 0.59%).
| Demographics | Rating | Rank | Female Poverty |
| Osage | 1.5 /100 | #232 | Tragic 14.8% |
| Immigrants | Saudi Arabia | 1.4 /100 | #233 | Tragic 14.8% |
| Fijians | 1.1 /100 | #234 | Tragic 14.9% |
| Immigrants | Laos | 0.9 /100 | #235 | Tragic 15.0% |
| Cree | 0.7 /100 | #236 | Tragic 15.1% |
| French American Indians | 0.6 /100 | #237 | Tragic 15.1% |
| Immigrants | Armenia | 0.6 /100 | #238 | Tragic 15.1% |
| Immigrants | Middle Africa | 0.5 /100 | #239 | Tragic 15.2% |
| Sudanese | 0.5 /100 | #240 | Tragic 15.2% |
| Immigrants | Sudan | 0.4 /100 | #241 | Tragic 15.2% |
| Nepalese | 0.4 /100 | #242 | Tragic 15.2% |
| Nicaraguans | 0.3 /100 | #243 | Tragic 15.3% |
| Ecuadorians | 0.3 /100 | #244 | Tragic 15.3% |
| Spanish American Indians | 0.3 /100 | #245 | Tragic 15.3% |
| Cubans | 0.3 /100 | #246 | Tragic 15.3% |
Demographics Similar to Immigrants from Argentina by Female Poverty
In terms of female poverty, the demographic groups most similar to Immigrants from Argentina are Immigrants from Jordan (12.8%, a difference of 0.010%), Immigrants from Vietnam (12.8%, a difference of 0.030%), Immigrants from Western Europe (12.8%, a difference of 0.070%), Immigrants from Brazil (12.8%, a difference of 0.22%), and Immigrants from Switzerland (12.9%, a difference of 0.24%).
| Demographics | Rating | Rank | Female Poverty |
| Immigrants | Norway | 89.3 /100 | #124 | Excellent 12.8% |
| Argentineans | 89.1 /100 | #125 | Excellent 12.8% |
| Immigrants | Ukraine | 88.8 /100 | #126 | Excellent 12.8% |
| South Africans | 88.4 /100 | #127 | Excellent 12.8% |
| Immigrants | Belarus | 88.2 /100 | #128 | Excellent 12.8% |
| Immigrants | Brazil | 87.9 /100 | #129 | Excellent 12.8% |
| Immigrants | Vietnam | 87.1 /100 | #130 | Excellent 12.8% |
| Immigrants | Argentina | 87.0 /100 | #131 | Excellent 12.8% |
| Immigrants | Jordan | 86.9 /100 | #132 | Excellent 12.8% |
| Immigrants | Western Europe | 86.6 /100 | #133 | Excellent 12.8% |
| Immigrants | Switzerland | 85.8 /100 | #134 | Excellent 12.9% |
| French | 85.6 /100 | #135 | Excellent 12.9% |
| Peruvians | 85.2 /100 | #136 | Excellent 12.9% |
| Chileans | 84.7 /100 | #137 | Excellent 12.9% |
| Immigrants | France | 83.6 /100 | #138 | Excellent 12.9% |