Immigrants from Nepal vs Immigrants from Argentina Female Poverty
COMPARE
Immigrants from Nepal
Immigrants from Argentina
Female Poverty
Female Poverty Comparison
Immigrants from Nepal
Immigrants from Argentina
13.3%
FEMALE POVERTY
62.7/ 100
METRIC RATING
160th/ 347
METRIC RANK
12.8%
FEMALE POVERTY
87.0/ 100
METRIC RATING
131st/ 347
METRIC RANK
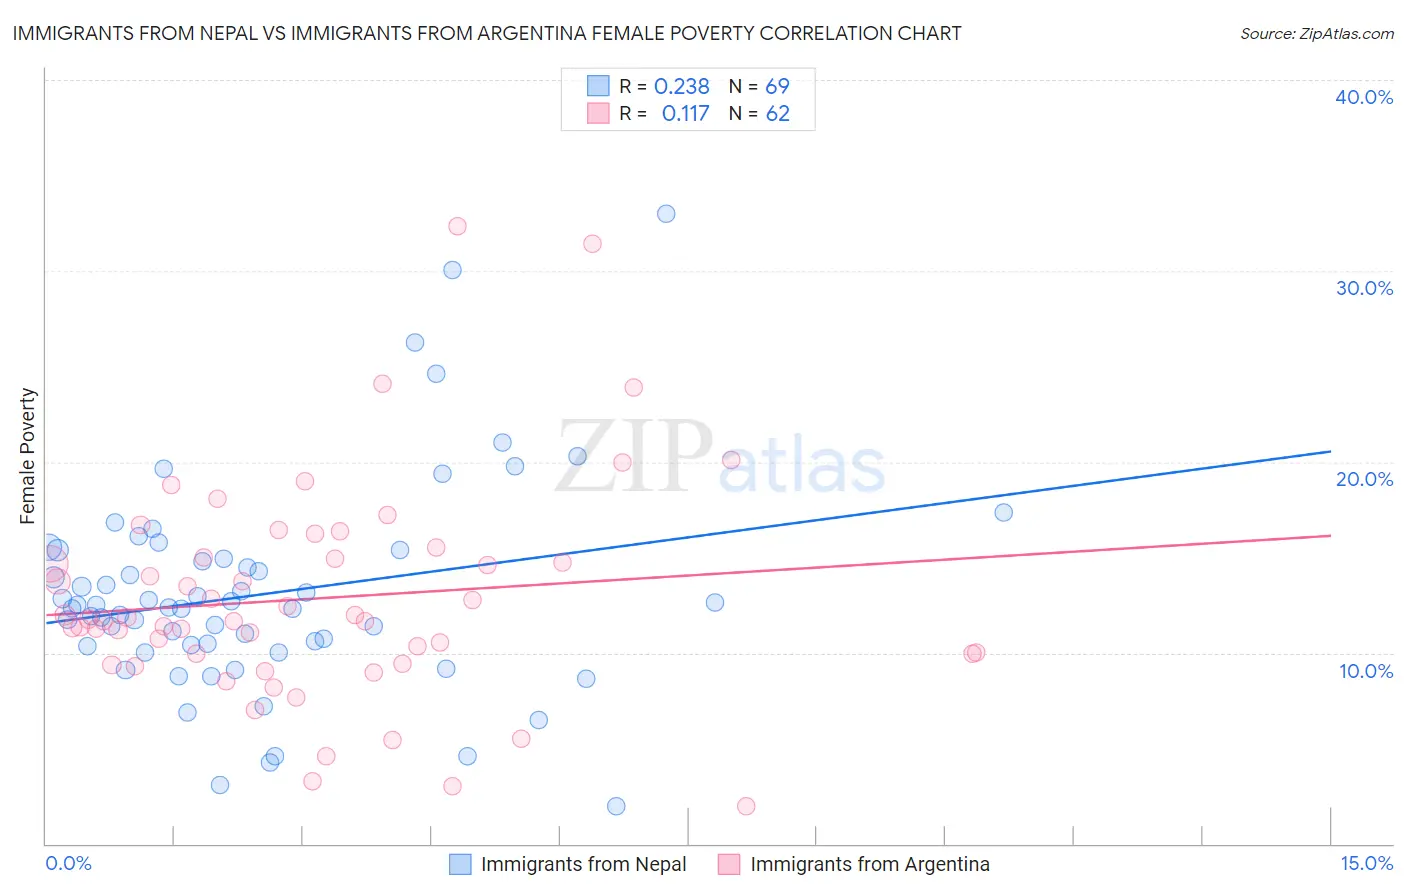
Immigrants from Nepal vs Immigrants from Argentina Female Poverty Correlation Chart
The statistical analysis conducted on geographies consisting of 186,688,907 people shows a weak positive correlation between the proportion of Immigrants from Nepal and poverty level among females in the United States with a correlation coefficient (R) of 0.238 and weighted average of 13.3%. Similarly, the statistical analysis conducted on geographies consisting of 264,332,384 people shows a poor positive correlation between the proportion of Immigrants from Argentina and poverty level among females in the United States with a correlation coefficient (R) of 0.117 and weighted average of 12.8%, a difference of 3.5%.
Female Poverty Correlation Summary
| Measurement | Immigrants from Nepal | Immigrants from Argentina |
| Minimum | 2.0% | 1.9% |
| Maximum | 33.0% | 32.3% |
| Range | 31.0% | 30.4% |
| Mean | 13.1% | 12.9% |
| Median | 12.4% | 11.7% |
| Interquartile 25% (IQ1) | 10.4% | 9.9% |
| Interquartile 75% (IQ3) | 15.2% | 15.0% |
| Interquartile Range (IQR) | 4.8% | 5.0% |
| Standard Deviation (Sample) | 5.5% | 5.7% |
| Standard Deviation (Population) | 5.5% | 5.7% |
Similar Demographics by Female Poverty
Demographics Similar to Immigrants from Nepal by Female Poverty
In terms of female poverty, the demographic groups most similar to Immigrants from Nepal are Immigrants from Ethiopia (13.3%, a difference of 0.030%), Guamanian/Chamorro (13.3%, a difference of 0.030%), Immigrants from Albania (13.3%, a difference of 0.040%), Ethiopian (13.3%, a difference of 0.050%), and Scotch-Irish (13.3%, a difference of 0.070%).
| Demographics | Rating | Rank | Female Poverty |
| Immigrants | Fiji | 71.0 /100 | #153 | Good 13.2% |
| Armenians | 70.4 /100 | #154 | Good 13.2% |
| Hungarians | 70.1 /100 | #155 | Good 13.2% |
| Immigrants | Bosnia and Herzegovina | 69.7 /100 | #156 | Good 13.2% |
| Immigrants | Northern Africa | 68.8 /100 | #157 | Good 13.2% |
| Pennsylvania Germans | 67.3 /100 | #158 | Good 13.2% |
| Costa Ricans | 63.6 /100 | #159 | Good 13.3% |
| Immigrants | Nepal | 62.7 /100 | #160 | Good 13.3% |
| Immigrants | Ethiopia | 62.5 /100 | #161 | Good 13.3% |
| Guamanians/Chamorros | 62.4 /100 | #162 | Good 13.3% |
| Immigrants | Albania | 62.4 /100 | #163 | Good 13.3% |
| Ethiopians | 62.3 /100 | #164 | Good 13.3% |
| Scotch-Irish | 62.1 /100 | #165 | Good 13.3% |
| Immigrants | Oceania | 59.7 /100 | #166 | Average 13.3% |
| Immigrants | Chile | 57.4 /100 | #167 | Average 13.3% |
Demographics Similar to Immigrants from Argentina by Female Poverty
In terms of female poverty, the demographic groups most similar to Immigrants from Argentina are Immigrants from Jordan (12.8%, a difference of 0.010%), Immigrants from Vietnam (12.8%, a difference of 0.030%), Immigrants from Western Europe (12.8%, a difference of 0.070%), Immigrants from Brazil (12.8%, a difference of 0.22%), and Immigrants from Switzerland (12.9%, a difference of 0.24%).
| Demographics | Rating | Rank | Female Poverty |
| Immigrants | Norway | 89.3 /100 | #124 | Excellent 12.8% |
| Argentineans | 89.1 /100 | #125 | Excellent 12.8% |
| Immigrants | Ukraine | 88.8 /100 | #126 | Excellent 12.8% |
| South Africans | 88.4 /100 | #127 | Excellent 12.8% |
| Immigrants | Belarus | 88.2 /100 | #128 | Excellent 12.8% |
| Immigrants | Brazil | 87.9 /100 | #129 | Excellent 12.8% |
| Immigrants | Vietnam | 87.1 /100 | #130 | Excellent 12.8% |
| Immigrants | Argentina | 87.0 /100 | #131 | Excellent 12.8% |
| Immigrants | Jordan | 86.9 /100 | #132 | Excellent 12.8% |
| Immigrants | Western Europe | 86.6 /100 | #133 | Excellent 12.8% |
| Immigrants | Switzerland | 85.8 /100 | #134 | Excellent 12.9% |
| French | 85.6 /100 | #135 | Excellent 12.9% |
| Peruvians | 85.2 /100 | #136 | Excellent 12.9% |
| Chileans | 84.7 /100 | #137 | Excellent 12.9% |
| Immigrants | France | 83.6 /100 | #138 | Excellent 12.9% |