Russian vs Immigrants from Argentina Female Poverty
COMPARE
Russian
Immigrants from Argentina
Female Poverty
Female Poverty Comparison
Russians
Immigrants from Argentina
11.8%
FEMALE POVERTY
99.3/ 100
METRIC RATING
38th/ 347
METRIC RANK
12.8%
FEMALE POVERTY
87.0/ 100
METRIC RATING
131st/ 347
METRIC RANK
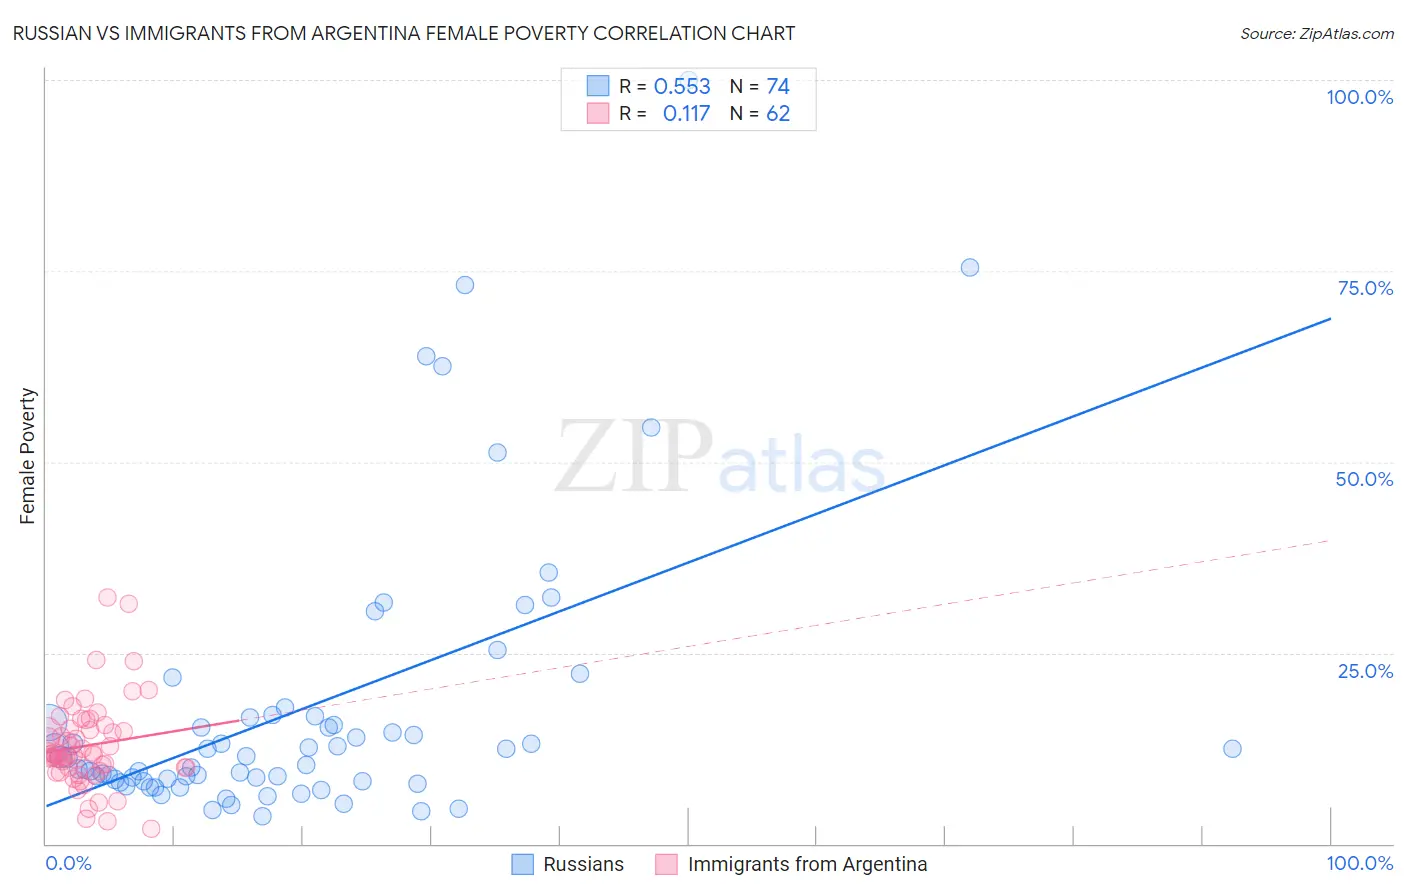
Russian vs Immigrants from Argentina Female Poverty Correlation Chart
The statistical analysis conducted on geographies consisting of 511,408,549 people shows a substantial positive correlation between the proportion of Russians and poverty level among females in the United States with a correlation coefficient (R) of 0.553 and weighted average of 11.8%. Similarly, the statistical analysis conducted on geographies consisting of 264,332,384 people shows a poor positive correlation between the proportion of Immigrants from Argentina and poverty level among females in the United States with a correlation coefficient (R) of 0.117 and weighted average of 12.8%, a difference of 8.5%.
Female Poverty Correlation Summary
| Measurement | Russian | Immigrants from Argentina |
| Minimum | 3.6% | 1.9% |
| Maximum | 100.0% | 32.3% |
| Range | 96.4% | 30.4% |
| Mean | 17.7% | 12.9% |
| Median | 11.4% | 11.7% |
| Interquartile 25% (IQ1) | 8.2% | 9.9% |
| Interquartile 75% (IQ3) | 16.5% | 15.0% |
| Interquartile Range (IQR) | 8.2% | 5.0% |
| Standard Deviation (Sample) | 18.5% | 5.7% |
| Standard Deviation (Population) | 18.4% | 5.7% |
Similar Demographics by Female Poverty
Demographics Similar to Russians by Female Poverty
In terms of female poverty, the demographic groups most similar to Russians are Immigrants from Greece (11.8%, a difference of 0.020%), Immigrants from Pakistan (11.8%, a difference of 0.11%), Immigrants from Poland (11.8%, a difference of 0.21%), Macedonian (11.8%, a difference of 0.26%), and Immigrants from Iran (11.8%, a difference of 0.28%).
| Demographics | Rating | Rank | Female Poverty |
| Poles | 99.5 /100 | #31 | Exceptional 11.7% |
| Danes | 99.5 /100 | #32 | Exceptional 11.7% |
| Cypriots | 99.5 /100 | #33 | Exceptional 11.8% |
| Immigrants | Singapore | 99.4 /100 | #34 | Exceptional 11.8% |
| Immigrants | Iran | 99.4 /100 | #35 | Exceptional 11.8% |
| Immigrants | Pakistan | 99.4 /100 | #36 | Exceptional 11.8% |
| Immigrants | Greece | 99.3 /100 | #37 | Exceptional 11.8% |
| Russians | 99.3 /100 | #38 | Exceptional 11.8% |
| Immigrants | Poland | 99.3 /100 | #39 | Exceptional 11.8% |
| Macedonians | 99.3 /100 | #40 | Exceptional 11.8% |
| Czechs | 99.2 /100 | #41 | Exceptional 11.9% |
| Immigrants | Moldova | 99.2 /100 | #42 | Exceptional 11.9% |
| Koreans | 99.2 /100 | #43 | Exceptional 11.9% |
| Tongans | 99.2 /100 | #44 | Exceptional 11.9% |
| Immigrants | Czechoslovakia | 99.2 /100 | #45 | Exceptional 11.9% |
Demographics Similar to Immigrants from Argentina by Female Poverty
In terms of female poverty, the demographic groups most similar to Immigrants from Argentina are Immigrants from Jordan (12.8%, a difference of 0.010%), Immigrants from Vietnam (12.8%, a difference of 0.030%), Immigrants from Western Europe (12.8%, a difference of 0.070%), Immigrants from Brazil (12.8%, a difference of 0.22%), and Immigrants from Switzerland (12.9%, a difference of 0.24%).
| Demographics | Rating | Rank | Female Poverty |
| Immigrants | Norway | 89.3 /100 | #124 | Excellent 12.8% |
| Argentineans | 89.1 /100 | #125 | Excellent 12.8% |
| Immigrants | Ukraine | 88.8 /100 | #126 | Excellent 12.8% |
| South Africans | 88.4 /100 | #127 | Excellent 12.8% |
| Immigrants | Belarus | 88.2 /100 | #128 | Excellent 12.8% |
| Immigrants | Brazil | 87.9 /100 | #129 | Excellent 12.8% |
| Immigrants | Vietnam | 87.1 /100 | #130 | Excellent 12.8% |
| Immigrants | Argentina | 87.0 /100 | #131 | Excellent 12.8% |
| Immigrants | Jordan | 86.9 /100 | #132 | Excellent 12.8% |
| Immigrants | Western Europe | 86.6 /100 | #133 | Excellent 12.8% |
| Immigrants | Switzerland | 85.8 /100 | #134 | Excellent 12.9% |
| French | 85.6 /100 | #135 | Excellent 12.9% |
| Peruvians | 85.2 /100 | #136 | Excellent 12.9% |
| Chileans | 84.7 /100 | #137 | Excellent 12.9% |
| Immigrants | France | 83.6 /100 | #138 | Excellent 12.9% |