Samoan vs Argentinean Family Poverty
COMPARE
Samoan
Argentinean
Family Poverty
Family Poverty Comparison
Samoans
Argentineans
8.6%
FAMILY POVERTY
79.8/ 100
METRIC RATING
152nd/ 347
METRIC RANK
8.4%
FAMILY POVERTY
89.6/ 100
METRIC RATING
128th/ 347
METRIC RANK
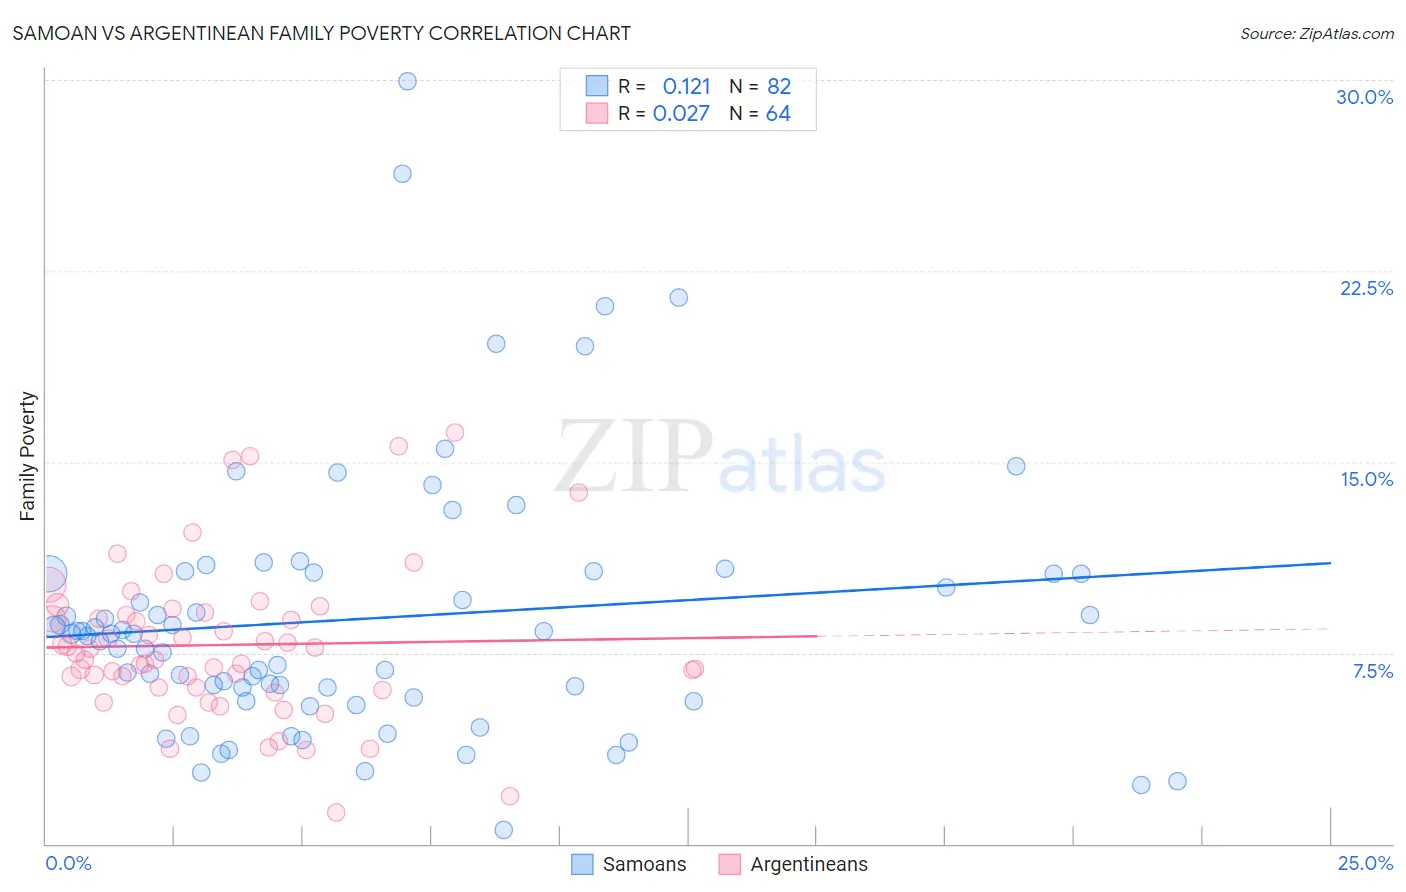
Samoan vs Argentinean Family Poverty Correlation Chart
The statistical analysis conducted on geographies consisting of 224,914,322 people shows a poor positive correlation between the proportion of Samoans and poverty level among families in the United States with a correlation coefficient (R) of 0.121 and weighted average of 8.6%. Similarly, the statistical analysis conducted on geographies consisting of 296,579,714 people shows no correlation between the proportion of Argentineans and poverty level among families in the United States with a correlation coefficient (R) of 0.027 and weighted average of 8.4%, a difference of 2.7%.
Family Poverty Correlation Summary
| Measurement | Samoan | Argentinean |
| Minimum | 0.54% | 1.2% |
| Maximum | 29.9% | 16.2% |
| Range | 29.4% | 14.9% |
| Mean | 8.8% | 7.8% |
| Median | 8.2% | 7.4% |
| Interquartile 25% (IQ1) | 5.7% | 6.2% |
| Interquartile 75% (IQ3) | 10.6% | 9.0% |
| Interquartile Range (IQR) | 4.9% | 2.9% |
| Standard Deviation (Sample) | 5.2% | 3.0% |
| Standard Deviation (Population) | 5.1% | 3.0% |
Similar Demographics by Family Poverty
Demographics Similar to Samoans by Family Poverty
In terms of family poverty, the demographic groups most similar to Samoans are Brazilian (8.6%, a difference of 0.080%), Mongolian (8.6%, a difference of 0.13%), Syrian (8.6%, a difference of 0.13%), Immigrants from Spain (8.6%, a difference of 0.14%), and Scotch-Irish (8.6%, a difference of 0.54%).
| Demographics | Rating | Rank | Family Poverty |
| Immigrants | South Eastern Asia | 83.2 /100 | #145 | Excellent 8.5% |
| Immigrants | Belarus | 83.2 /100 | #146 | Excellent 8.5% |
| Immigrants | Jordan | 83.0 /100 | #147 | Excellent 8.5% |
| Scotch-Irish | 82.2 /100 | #148 | Excellent 8.6% |
| Mongolians | 80.4 /100 | #149 | Excellent 8.6% |
| Syrians | 80.3 /100 | #150 | Excellent 8.6% |
| Brazilians | 80.1 /100 | #151 | Excellent 8.6% |
| Samoans | 79.8 /100 | #152 | Good 8.6% |
| Immigrants | Spain | 79.1 /100 | #153 | Good 8.6% |
| Immigrants | Vietnam | 75.4 /100 | #154 | Good 8.7% |
| Immigrants | Kuwait | 73.6 /100 | #155 | Good 8.7% |
| Immigrants | Oceania | 71.2 /100 | #156 | Good 8.7% |
| Tsimshian | 69.3 /100 | #157 | Good 8.8% |
| Whites/Caucasians | 69.1 /100 | #158 | Good 8.8% |
| Peruvians | 68.0 /100 | #159 | Good 8.8% |
Demographics Similar to Argentineans by Family Poverty
In terms of family poverty, the demographic groups most similar to Argentineans are Immigrants from Hungary (8.4%, a difference of 0.14%), Portuguese (8.4%, a difference of 0.15%), Icelander (8.3%, a difference of 0.27%), Immigrants from Bosnia and Herzegovina (8.4%, a difference of 0.34%), and Puget Sound Salish (8.4%, a difference of 0.35%).
| Demographics | Rating | Rank | Family Poverty |
| Native Hawaiians | 91.3 /100 | #121 | Exceptional 8.3% |
| Paraguayans | 91.2 /100 | #122 | Exceptional 8.3% |
| Palestinians | 91.1 /100 | #123 | Exceptional 8.3% |
| Soviet Union | 90.8 /100 | #124 | Exceptional 8.3% |
| Pakistanis | 90.8 /100 | #125 | Exceptional 8.3% |
| Icelanders | 90.3 /100 | #126 | Exceptional 8.3% |
| Immigrants | Hungary | 89.9 /100 | #127 | Excellent 8.4% |
| Argentineans | 89.6 /100 | #128 | Excellent 8.4% |
| Portuguese | 89.2 /100 | #129 | Excellent 8.4% |
| Immigrants | Bosnia and Herzegovina | 88.6 /100 | #130 | Excellent 8.4% |
| Puget Sound Salish | 88.6 /100 | #131 | Excellent 8.4% |
| Immigrants | Argentina | 88.2 /100 | #132 | Excellent 8.4% |
| Sri Lankans | 86.6 /100 | #133 | Excellent 8.5% |
| Chileans | 86.6 /100 | #134 | Excellent 8.5% |
| Immigrants | Malaysia | 86.5 /100 | #135 | Excellent 8.5% |