Potawatomi vs Argentinean Family Poverty
COMPARE
Potawatomi
Argentinean
Family Poverty
Family Poverty Comparison
Potawatomi
Argentineans
10.2%
FAMILY POVERTY
1.5/ 100
METRIC RATING
239th/ 347
METRIC RANK
8.4%
FAMILY POVERTY
89.6/ 100
METRIC RATING
128th/ 347
METRIC RANK
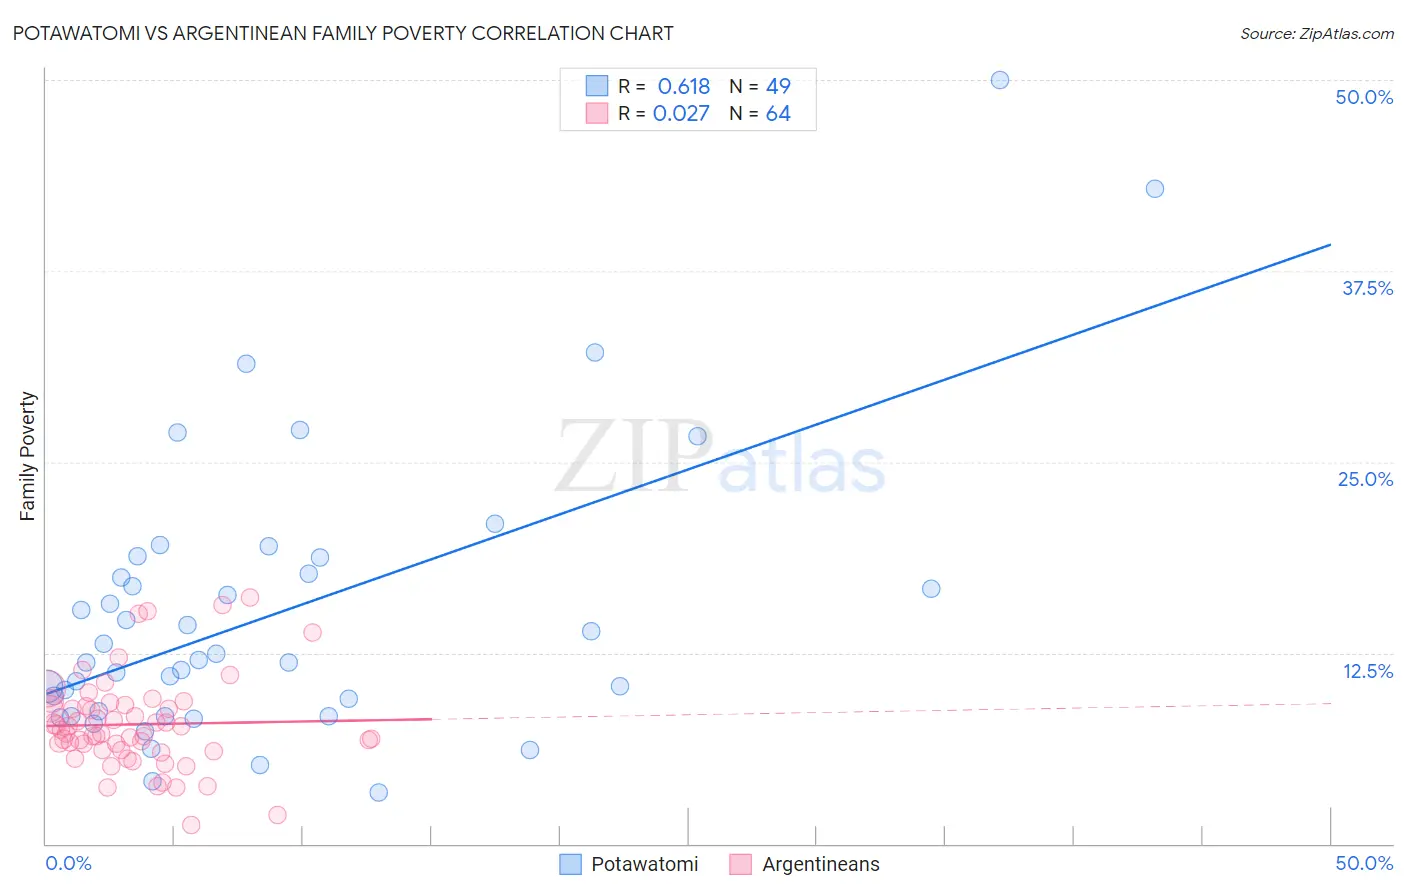
Potawatomi vs Argentinean Family Poverty Correlation Chart
The statistical analysis conducted on geographies consisting of 117,705,487 people shows a significant positive correlation between the proportion of Potawatomi and poverty level among families in the United States with a correlation coefficient (R) of 0.618 and weighted average of 10.2%. Similarly, the statistical analysis conducted on geographies consisting of 296,579,714 people shows no correlation between the proportion of Argentineans and poverty level among families in the United States with a correlation coefficient (R) of 0.027 and weighted average of 8.4%, a difference of 22.3%.
Family Poverty Correlation Summary
| Measurement | Potawatomi | Argentinean |
| Minimum | 3.4% | 1.2% |
| Maximum | 50.0% | 16.2% |
| Range | 46.6% | 14.9% |
| Mean | 15.1% | 7.8% |
| Median | 12.0% | 7.4% |
| Interquartile 25% (IQ1) | 8.5% | 6.2% |
| Interquartile 75% (IQ3) | 18.2% | 9.0% |
| Interquartile Range (IQR) | 9.7% | 2.9% |
| Standard Deviation (Sample) | 9.4% | 3.0% |
| Standard Deviation (Population) | 9.3% | 3.0% |
Similar Demographics by Family Poverty
Demographics Similar to Potawatomi by Family Poverty
In terms of family poverty, the demographic groups most similar to Potawatomi are French American Indian (10.2%, a difference of 0.040%), Immigrants from the Azores (10.3%, a difference of 0.31%), Ghanaian (10.3%, a difference of 0.39%), Immigrants from Laos (10.2%, a difference of 0.40%), and Immigrants from Nigeria (10.2%, a difference of 0.67%).
| Demographics | Rating | Rank | Family Poverty |
| Immigrants | Sudan | 2.3 /100 | #232 | Tragic 10.1% |
| Fijians | 2.1 /100 | #233 | Tragic 10.1% |
| Immigrants | Middle Africa | 2.1 /100 | #234 | Tragic 10.1% |
| Nigerians | 2.0 /100 | #235 | Tragic 10.1% |
| Immigrants | Nigeria | 1.9 /100 | #236 | Tragic 10.2% |
| Immigrants | Laos | 1.7 /100 | #237 | Tragic 10.2% |
| French American Indians | 1.5 /100 | #238 | Tragic 10.2% |
| Potawatomi | 1.5 /100 | #239 | Tragic 10.2% |
| Immigrants | Azores | 1.4 /100 | #240 | Tragic 10.3% |
| Ghanaians | 1.3 /100 | #241 | Tragic 10.3% |
| Alaska Natives | 1.0 /100 | #242 | Tragic 10.4% |
| Nepalese | 0.8 /100 | #243 | Tragic 10.4% |
| Cree | 0.7 /100 | #244 | Tragic 10.5% |
| Immigrants | Burma/Myanmar | 0.6 /100 | #245 | Tragic 10.5% |
| Cherokee | 0.5 /100 | #246 | Tragic 10.6% |
Demographics Similar to Argentineans by Family Poverty
In terms of family poverty, the demographic groups most similar to Argentineans are Immigrants from Hungary (8.4%, a difference of 0.14%), Portuguese (8.4%, a difference of 0.15%), Icelander (8.3%, a difference of 0.27%), Immigrants from Bosnia and Herzegovina (8.4%, a difference of 0.34%), and Puget Sound Salish (8.4%, a difference of 0.35%).
| Demographics | Rating | Rank | Family Poverty |
| Native Hawaiians | 91.3 /100 | #121 | Exceptional 8.3% |
| Paraguayans | 91.2 /100 | #122 | Exceptional 8.3% |
| Palestinians | 91.1 /100 | #123 | Exceptional 8.3% |
| Soviet Union | 90.8 /100 | #124 | Exceptional 8.3% |
| Pakistanis | 90.8 /100 | #125 | Exceptional 8.3% |
| Icelanders | 90.3 /100 | #126 | Exceptional 8.3% |
| Immigrants | Hungary | 89.9 /100 | #127 | Excellent 8.4% |
| Argentineans | 89.6 /100 | #128 | Excellent 8.4% |
| Portuguese | 89.2 /100 | #129 | Excellent 8.4% |
| Immigrants | Bosnia and Herzegovina | 88.6 /100 | #130 | Excellent 8.4% |
| Puget Sound Salish | 88.6 /100 | #131 | Excellent 8.4% |
| Immigrants | Argentina | 88.2 /100 | #132 | Excellent 8.4% |
| Sri Lankans | 86.6 /100 | #133 | Excellent 8.5% |
| Chileans | 86.6 /100 | #134 | Excellent 8.5% |
| Immigrants | Malaysia | 86.5 /100 | #135 | Excellent 8.5% |