Samoan vs Arapaho Family Poverty
COMPARE
Samoan
Arapaho
Family Poverty
Family Poverty Comparison
Samoans
Arapaho
8.6%
FAMILY POVERTY
79.8/ 100
METRIC RATING
152nd/ 347
METRIC RANK
12.7%
FAMILY POVERTY
0.0/ 100
METRIC RATING
321st/ 347
METRIC RANK
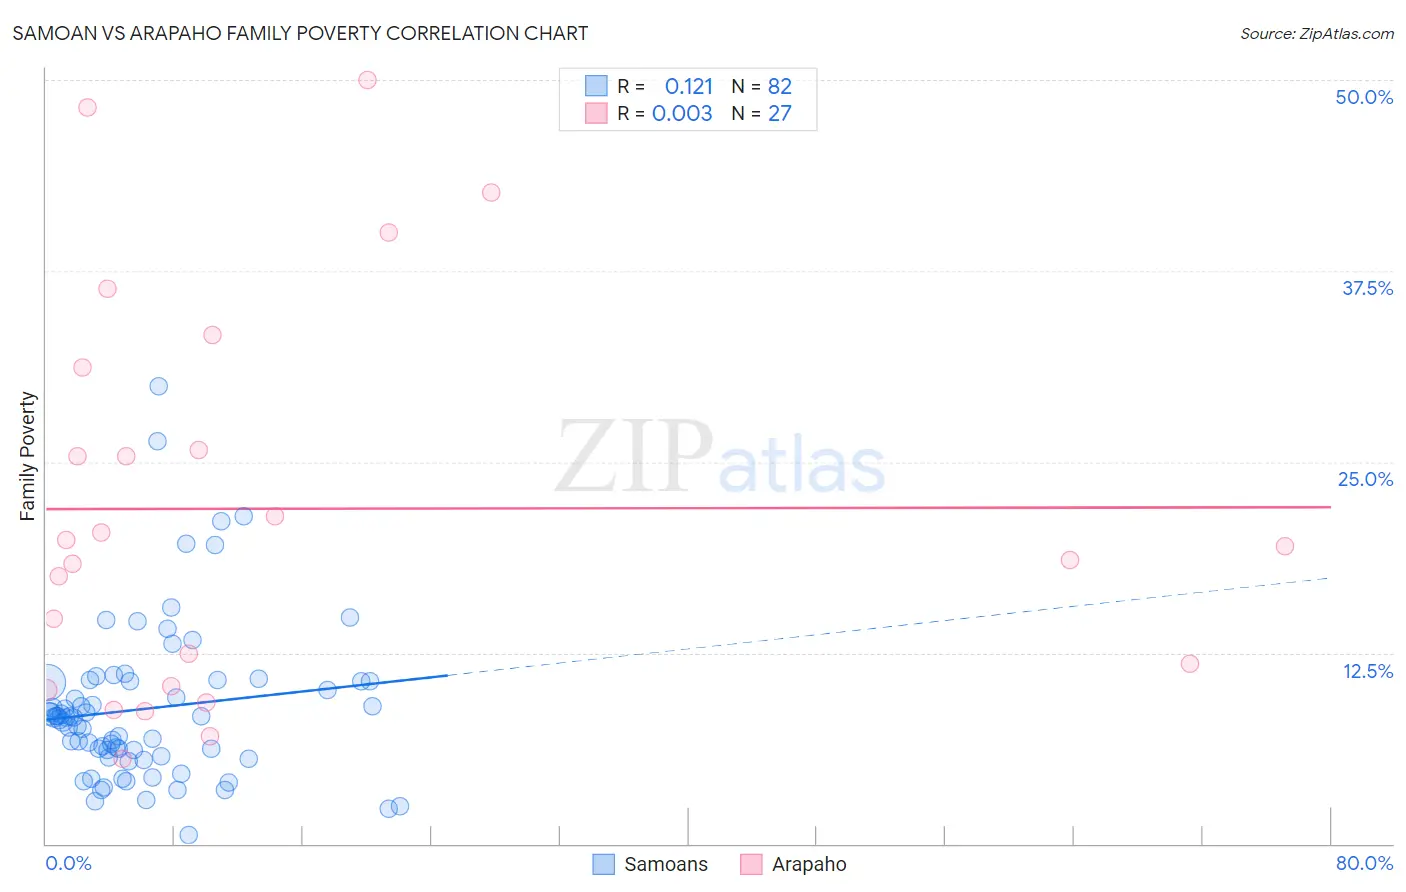
Samoan vs Arapaho Family Poverty Correlation Chart
The statistical analysis conducted on geographies consisting of 224,914,322 people shows a poor positive correlation between the proportion of Samoans and poverty level among families in the United States with a correlation coefficient (R) of 0.121 and weighted average of 8.6%. Similarly, the statistical analysis conducted on geographies consisting of 29,764,504 people shows no correlation between the proportion of Arapaho and poverty level among families in the United States with a correlation coefficient (R) of 0.003 and weighted average of 12.7%, a difference of 47.1%.
Family Poverty Correlation Summary
| Measurement | Samoan | Arapaho |
| Minimum | 0.54% | 5.6% |
| Maximum | 29.9% | 50.0% |
| Range | 29.4% | 44.4% |
| Mean | 8.8% | 21.9% |
| Median | 8.2% | 19.5% |
| Interquartile 25% (IQ1) | 5.7% | 10.3% |
| Interquartile 75% (IQ3) | 10.6% | 31.2% |
| Interquartile Range (IQR) | 4.9% | 20.8% |
| Standard Deviation (Sample) | 5.2% | 12.8% |
| Standard Deviation (Population) | 5.1% | 12.6% |
Similar Demographics by Family Poverty
Demographics Similar to Samoans by Family Poverty
In terms of family poverty, the demographic groups most similar to Samoans are Brazilian (8.6%, a difference of 0.080%), Mongolian (8.6%, a difference of 0.13%), Syrian (8.6%, a difference of 0.13%), Immigrants from Spain (8.6%, a difference of 0.14%), and Scotch-Irish (8.6%, a difference of 0.54%).
| Demographics | Rating | Rank | Family Poverty |
| Immigrants | South Eastern Asia | 83.2 /100 | #145 | Excellent 8.5% |
| Immigrants | Belarus | 83.2 /100 | #146 | Excellent 8.5% |
| Immigrants | Jordan | 83.0 /100 | #147 | Excellent 8.5% |
| Scotch-Irish | 82.2 /100 | #148 | Excellent 8.6% |
| Mongolians | 80.4 /100 | #149 | Excellent 8.6% |
| Syrians | 80.3 /100 | #150 | Excellent 8.6% |
| Brazilians | 80.1 /100 | #151 | Excellent 8.6% |
| Samoans | 79.8 /100 | #152 | Good 8.6% |
| Immigrants | Spain | 79.1 /100 | #153 | Good 8.6% |
| Immigrants | Vietnam | 75.4 /100 | #154 | Good 8.7% |
| Immigrants | Kuwait | 73.6 /100 | #155 | Good 8.7% |
| Immigrants | Oceania | 71.2 /100 | #156 | Good 8.7% |
| Tsimshian | 69.3 /100 | #157 | Good 8.8% |
| Whites/Caucasians | 69.1 /100 | #158 | Good 8.8% |
| Peruvians | 68.0 /100 | #159 | Good 8.8% |
Demographics Similar to Arapaho by Family Poverty
In terms of family poverty, the demographic groups most similar to Arapaho are Immigrants from Honduras (12.7%, a difference of 0.10%), Menominee (12.7%, a difference of 0.65%), Immigrants from Dominica (12.7%, a difference of 0.72%), Inupiat (12.5%, a difference of 1.5%), and British West Indian (12.4%, a difference of 2.0%).
| Demographics | Rating | Rank | Family Poverty |
| Kiowa | 0.0 /100 | #314 | Tragic 12.2% |
| Immigrants | Mexico | 0.0 /100 | #315 | Tragic 12.3% |
| Hondurans | 0.0 /100 | #316 | Tragic 12.4% |
| Immigrants | Grenada | 0.0 /100 | #317 | Tragic 12.4% |
| U.S. Virgin Islanders | 0.0 /100 | #318 | Tragic 12.4% |
| British West Indians | 0.0 /100 | #319 | Tragic 12.4% |
| Inupiat | 0.0 /100 | #320 | Tragic 12.5% |
| Arapaho | 0.0 /100 | #321 | Tragic 12.7% |
| Immigrants | Honduras | 0.0 /100 | #322 | Tragic 12.7% |
| Menominee | 0.0 /100 | #323 | Tragic 12.7% |
| Immigrants | Dominica | 0.0 /100 | #324 | Tragic 12.7% |
| Paiute | 0.0 /100 | #325 | Tragic 13.0% |
| Colville | 0.0 /100 | #326 | Tragic 13.0% |
| Yakama | 0.0 /100 | #327 | Tragic 13.1% |
| Central American Indians | 0.0 /100 | #328 | Tragic 13.3% |