Samoan vs Immigrants from South Eastern Asia Family Poverty
COMPARE
Samoan
Immigrants from South Eastern Asia
Family Poverty
Family Poverty Comparison
Samoans
Immigrants from South Eastern Asia
8.6%
FAMILY POVERTY
79.8/ 100
METRIC RATING
152nd/ 347
METRIC RANK
8.5%
FAMILY POVERTY
83.2/ 100
METRIC RATING
145th/ 347
METRIC RANK
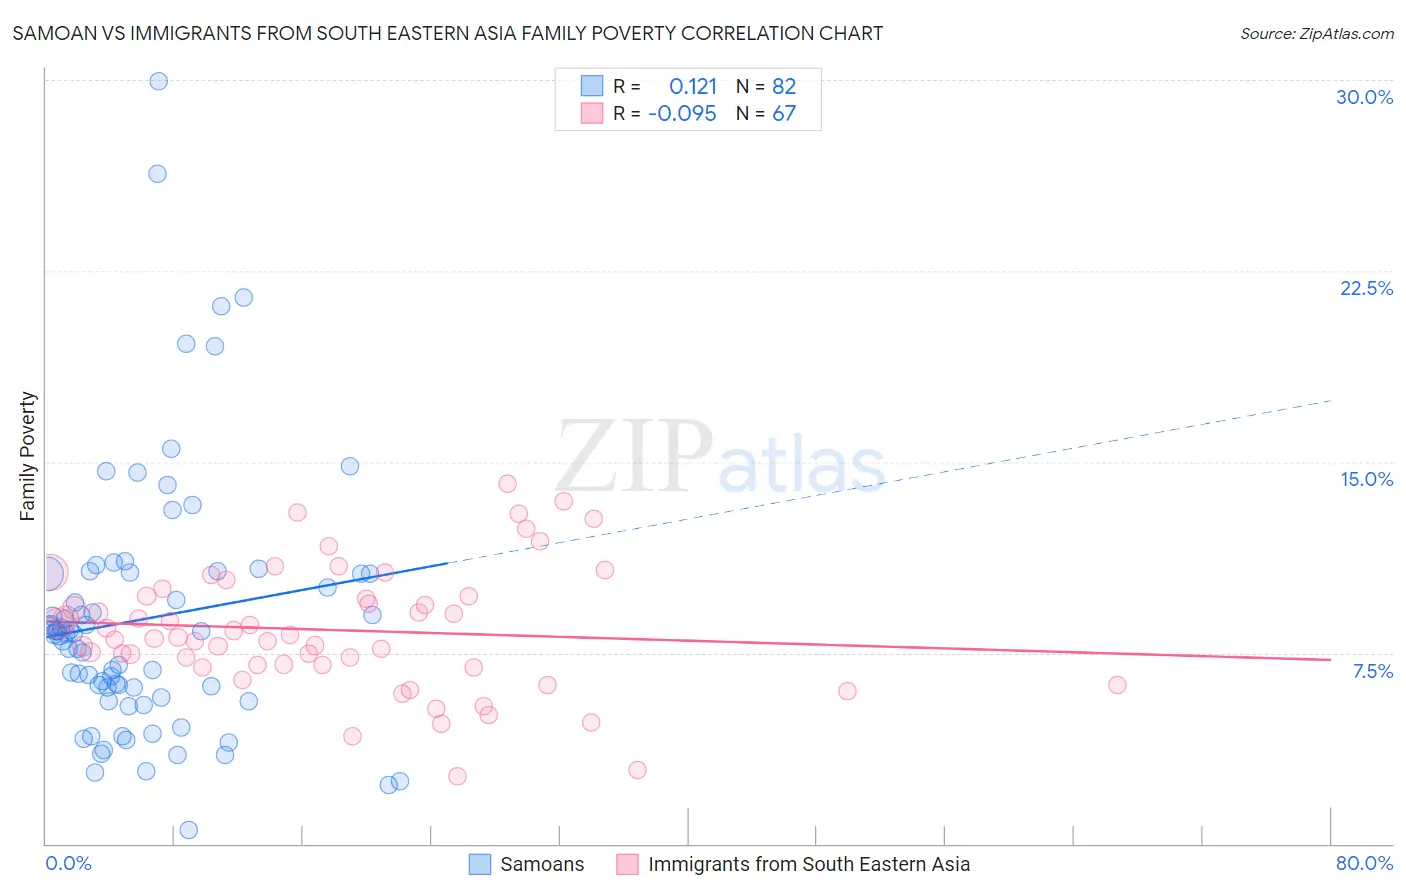
Samoan vs Immigrants from South Eastern Asia Family Poverty Correlation Chart
The statistical analysis conducted on geographies consisting of 224,914,322 people shows a poor positive correlation between the proportion of Samoans and poverty level among families in the United States with a correlation coefficient (R) of 0.121 and weighted average of 8.6%. Similarly, the statistical analysis conducted on geographies consisting of 510,315,048 people shows a slight negative correlation between the proportion of Immigrants from South Eastern Asia and poverty level among families in the United States with a correlation coefficient (R) of -0.095 and weighted average of 8.5%, a difference of 0.79%.
Family Poverty Correlation Summary
| Measurement | Samoan | Immigrants from South Eastern Asia |
| Minimum | 0.54% | 2.6% |
| Maximum | 29.9% | 14.1% |
| Range | 29.4% | 11.5% |
| Mean | 8.8% | 8.4% |
| Median | 8.2% | 8.1% |
| Interquartile 25% (IQ1) | 5.7% | 7.0% |
| Interquartile 75% (IQ3) | 10.6% | 9.7% |
| Interquartile Range (IQR) | 4.9% | 2.7% |
| Standard Deviation (Sample) | 5.2% | 2.4% |
| Standard Deviation (Population) | 5.1% | 2.4% |
Demographics Similar to Samoans and Immigrants from South Eastern Asia by Family Poverty
In terms of family poverty, the demographic groups most similar to Samoans are Brazilian (8.6%, a difference of 0.080%), Mongolian (8.6%, a difference of 0.13%), Syrian (8.6%, a difference of 0.13%), Immigrants from Spain (8.6%, a difference of 0.14%), and Scotch-Irish (8.6%, a difference of 0.54%). Similarly, the demographic groups most similar to Immigrants from South Eastern Asia are Immigrants from Belarus (8.5%, a difference of 0.010%), Albanian (8.5%, a difference of 0.020%), Immigrants from Germany (8.5%, a difference of 0.040%), Immigrants from Jordan (8.5%, a difference of 0.050%), and Yugoslavian (8.5%, a difference of 0.070%).
| Demographics | Rating | Rank | Family Poverty |
| Armenians | 84.6 /100 | #138 | Excellent 8.5% |
| Immigrants | Nepal | 84.2 /100 | #139 | Excellent 8.5% |
| Immigrants | Kazakhstan | 84.1 /100 | #140 | Excellent 8.5% |
| Immigrants | Ukraine | 83.9 /100 | #141 | Excellent 8.5% |
| Yugoslavians | 83.5 /100 | #142 | Excellent 8.5% |
| Immigrants | Germany | 83.3 /100 | #143 | Excellent 8.5% |
| Albanians | 83.3 /100 | #144 | Excellent 8.5% |
| Immigrants | South Eastern Asia | 83.2 /100 | #145 | Excellent 8.5% |
| Immigrants | Belarus | 83.2 /100 | #146 | Excellent 8.5% |
| Immigrants | Jordan | 83.0 /100 | #147 | Excellent 8.5% |
| Scotch-Irish | 82.2 /100 | #148 | Excellent 8.6% |
| Mongolians | 80.4 /100 | #149 | Excellent 8.6% |
| Syrians | 80.3 /100 | #150 | Excellent 8.6% |
| Brazilians | 80.1 /100 | #151 | Excellent 8.6% |
| Samoans | 79.8 /100 | #152 | Good 8.6% |
| Immigrants | Spain | 79.1 /100 | #153 | Good 8.6% |
| Immigrants | Vietnam | 75.4 /100 | #154 | Good 8.7% |
| Immigrants | Kuwait | 73.6 /100 | #155 | Good 8.7% |
| Immigrants | Oceania | 71.2 /100 | #156 | Good 8.7% |
| Tsimshian | 69.3 /100 | #157 | Good 8.8% |
| Whites/Caucasians | 69.1 /100 | #158 | Good 8.8% |