Immigrants from Austria vs Argentinean Family Poverty
COMPARE
Immigrants from Austria
Argentinean
Family Poverty
Family Poverty Comparison
Immigrants from Austria
Argentineans
7.6%
FAMILY POVERTY
99.1/ 100
METRIC RATING
43rd/ 347
METRIC RANK
8.4%
FAMILY POVERTY
89.6/ 100
METRIC RATING
128th/ 347
METRIC RANK
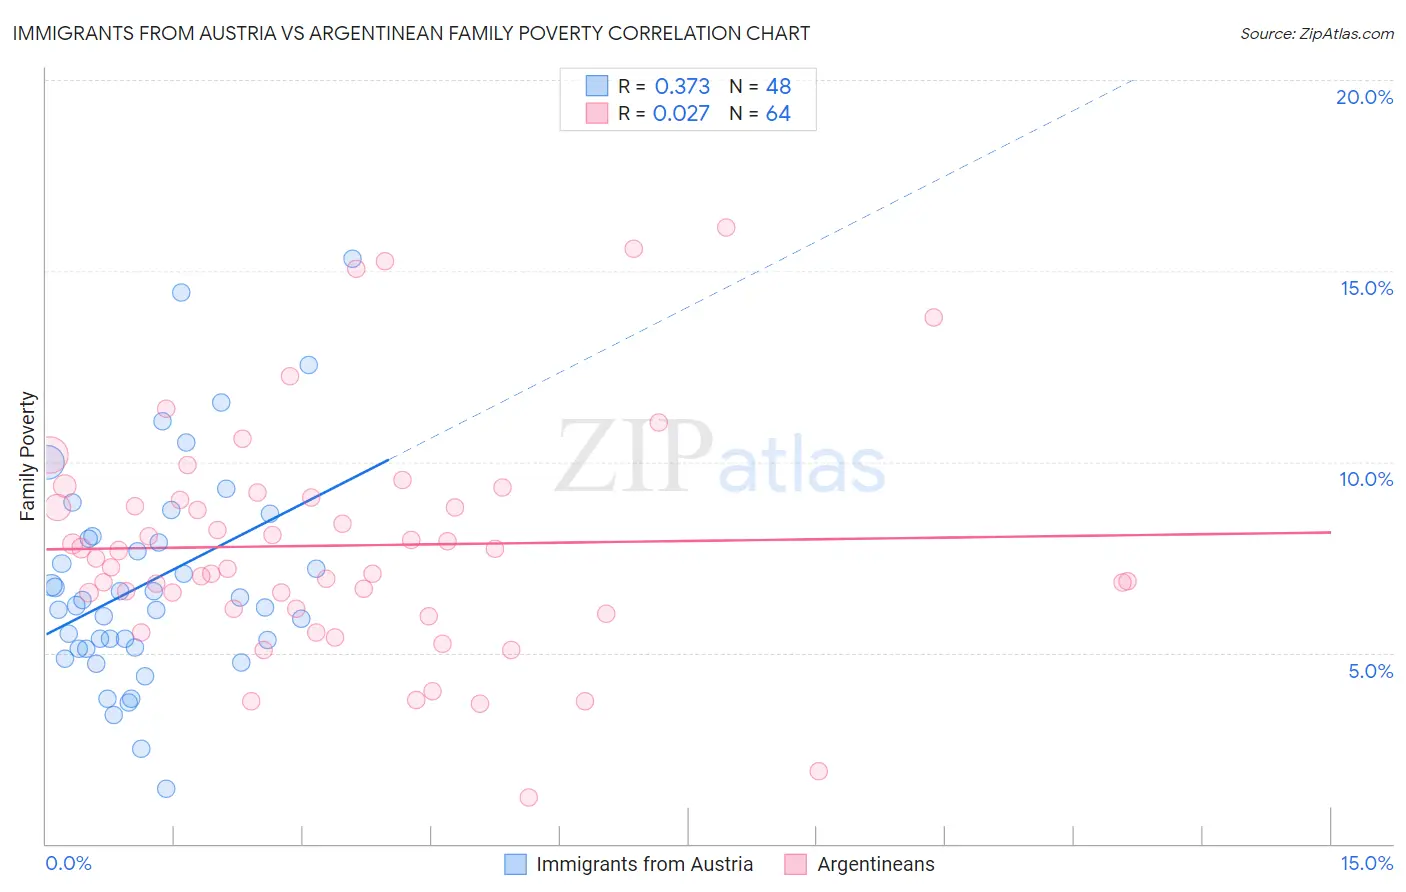
Immigrants from Austria vs Argentinean Family Poverty Correlation Chart
The statistical analysis conducted on geographies consisting of 167,754,432 people shows a mild positive correlation between the proportion of Immigrants from Austria and poverty level among families in the United States with a correlation coefficient (R) of 0.373 and weighted average of 7.6%. Similarly, the statistical analysis conducted on geographies consisting of 296,579,714 people shows no correlation between the proportion of Argentineans and poverty level among families in the United States with a correlation coefficient (R) of 0.027 and weighted average of 8.4%, a difference of 9.7%.
Family Poverty Correlation Summary
| Measurement | Immigrants from Austria | Argentinean |
| Minimum | 1.4% | 1.2% |
| Maximum | 15.3% | 16.2% |
| Range | 13.9% | 14.9% |
| Mean | 6.9% | 7.8% |
| Median | 6.3% | 7.4% |
| Interquartile 25% (IQ1) | 5.1% | 6.2% |
| Interquartile 75% (IQ3) | 8.0% | 9.0% |
| Interquartile Range (IQR) | 2.9% | 2.9% |
| Standard Deviation (Sample) | 2.8% | 3.0% |
| Standard Deviation (Population) | 2.8% | 3.0% |
Similar Demographics by Family Poverty
Demographics Similar to Immigrants from Austria by Family Poverty
In terms of family poverty, the demographic groups most similar to Immigrants from Austria are Scandinavian (7.6%, a difference of 0.24%), German (7.7%, a difference of 0.29%), Okinawan (7.7%, a difference of 0.41%), Tongan (7.7%, a difference of 0.43%), and Immigrants from Czechoslovakia (7.7%, a difference of 0.44%).
| Demographics | Rating | Rank | Family Poverty |
| Turks | 99.4 /100 | #36 | Exceptional 7.5% |
| Estonians | 99.4 /100 | #37 | Exceptional 7.5% |
| Bolivians | 99.3 /100 | #38 | Exceptional 7.5% |
| Carpatho Rusyns | 99.3 /100 | #39 | Exceptional 7.5% |
| Slovenes | 99.3 /100 | #40 | Exceptional 7.5% |
| Immigrants | Australia | 99.2 /100 | #41 | Exceptional 7.6% |
| Scandinavians | 99.1 /100 | #42 | Exceptional 7.6% |
| Immigrants | Austria | 99.1 /100 | #43 | Exceptional 7.6% |
| Germans | 99.0 /100 | #44 | Exceptional 7.7% |
| Okinawans | 98.9 /100 | #45 | Exceptional 7.7% |
| Tongans | 98.9 /100 | #46 | Exceptional 7.7% |
| Immigrants | Czechoslovakia | 98.9 /100 | #47 | Exceptional 7.7% |
| Immigrants | Sri Lanka | 98.9 /100 | #48 | Exceptional 7.7% |
| Immigrants | Bolivia | 98.9 /100 | #49 | Exceptional 7.7% |
| Immigrants | North Macedonia | 98.9 /100 | #50 | Exceptional 7.7% |
Demographics Similar to Argentineans by Family Poverty
In terms of family poverty, the demographic groups most similar to Argentineans are Immigrants from Hungary (8.4%, a difference of 0.14%), Portuguese (8.4%, a difference of 0.15%), Icelander (8.3%, a difference of 0.27%), Immigrants from Bosnia and Herzegovina (8.4%, a difference of 0.34%), and Puget Sound Salish (8.4%, a difference of 0.35%).
| Demographics | Rating | Rank | Family Poverty |
| Native Hawaiians | 91.3 /100 | #121 | Exceptional 8.3% |
| Paraguayans | 91.2 /100 | #122 | Exceptional 8.3% |
| Palestinians | 91.1 /100 | #123 | Exceptional 8.3% |
| Soviet Union | 90.8 /100 | #124 | Exceptional 8.3% |
| Pakistanis | 90.8 /100 | #125 | Exceptional 8.3% |
| Icelanders | 90.3 /100 | #126 | Exceptional 8.3% |
| Immigrants | Hungary | 89.9 /100 | #127 | Excellent 8.4% |
| Argentineans | 89.6 /100 | #128 | Excellent 8.4% |
| Portuguese | 89.2 /100 | #129 | Excellent 8.4% |
| Immigrants | Bosnia and Herzegovina | 88.6 /100 | #130 | Excellent 8.4% |
| Puget Sound Salish | 88.6 /100 | #131 | Excellent 8.4% |
| Immigrants | Argentina | 88.2 /100 | #132 | Excellent 8.4% |
| Sri Lankans | 86.6 /100 | #133 | Excellent 8.5% |
| Chileans | 86.6 /100 | #134 | Excellent 8.5% |
| Immigrants | Malaysia | 86.5 /100 | #135 | Excellent 8.5% |