Lebanese vs Arapaho Family Poverty
COMPARE
Lebanese
Arapaho
Family Poverty
Family Poverty Comparison
Lebanese
Arapaho
8.9%
FAMILY POVERTY
57.6/ 100
METRIC RATING
171st/ 347
METRIC RANK
12.7%
FAMILY POVERTY
0.0/ 100
METRIC RATING
321st/ 347
METRIC RANK
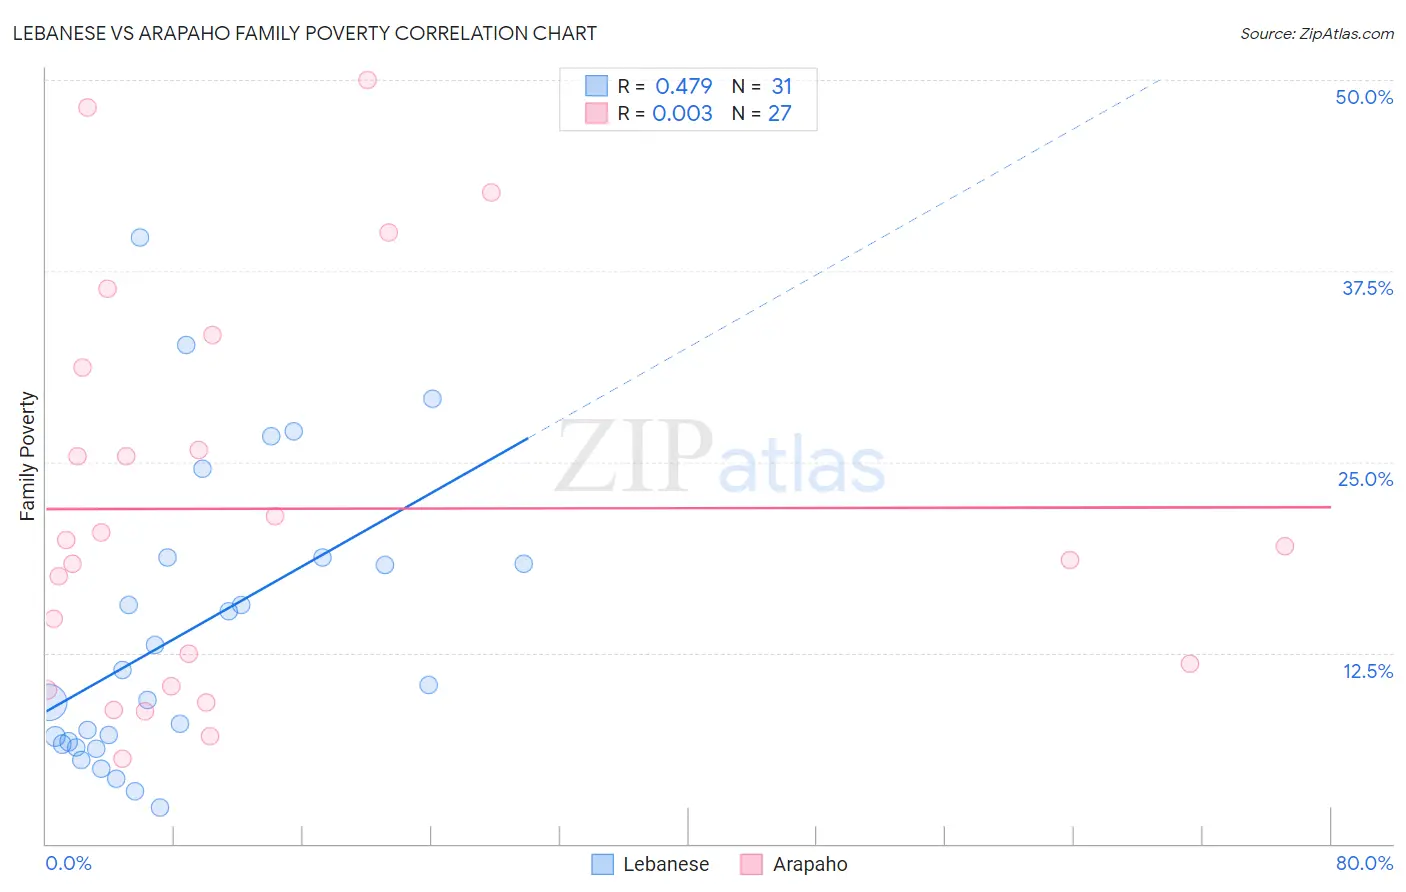
Lebanese vs Arapaho Family Poverty Correlation Chart
The statistical analysis conducted on geographies consisting of 400,253,340 people shows a moderate positive correlation between the proportion of Lebanese and poverty level among families in the United States with a correlation coefficient (R) of 0.479 and weighted average of 8.9%. Similarly, the statistical analysis conducted on geographies consisting of 29,764,504 people shows no correlation between the proportion of Arapaho and poverty level among families in the United States with a correlation coefficient (R) of 0.003 and weighted average of 12.7%, a difference of 41.9%.
Family Poverty Correlation Summary
| Measurement | Lebanese | Arapaho |
| Minimum | 2.3% | 5.6% |
| Maximum | 39.7% | 50.0% |
| Range | 37.3% | 44.4% |
| Mean | 13.8% | 21.9% |
| Median | 10.4% | 19.5% |
| Interquartile 25% (IQ1) | 6.5% | 10.3% |
| Interquartile 75% (IQ3) | 18.7% | 31.2% |
| Interquartile Range (IQR) | 12.2% | 20.8% |
| Standard Deviation (Sample) | 9.5% | 12.8% |
| Standard Deviation (Population) | 9.4% | 12.6% |
Similar Demographics by Family Poverty
Demographics Similar to Lebanese by Family Poverty
In terms of family poverty, the demographic groups most similar to Lebanese are Immigrants from Peru (8.9%, a difference of 0.010%), Kenyan (8.9%, a difference of 0.080%), Immigrants from Fiji (8.9%, a difference of 0.16%), Immigrants from Chile (8.9%, a difference of 0.27%), and Israeli (8.9%, a difference of 0.62%).
| Demographics | Rating | Rank | Family Poverty |
| Celtics | 64.9 /100 | #164 | Good 8.8% |
| Guamanians/Chamorros | 64.7 /100 | #165 | Good 8.8% |
| Afghans | 63.5 /100 | #166 | Good 8.8% |
| Immigrants | Ethiopia | 62.5 /100 | #167 | Good 8.9% |
| Israelis | 62.1 /100 | #168 | Good 8.9% |
| Immigrants | Chile | 59.6 /100 | #169 | Average 8.9% |
| Kenyans | 58.2 /100 | #170 | Average 8.9% |
| Lebanese | 57.6 /100 | #171 | Average 8.9% |
| Immigrants | Peru | 57.5 /100 | #172 | Average 8.9% |
| Immigrants | Fiji | 56.4 /100 | #173 | Average 8.9% |
| Immigrants | Albania | 50.0 /100 | #174 | Average 9.0% |
| Costa Ricans | 49.3 /100 | #175 | Average 9.0% |
| Immigrants | Syria | 47.5 /100 | #176 | Average 9.0% |
| Hawaiians | 47.2 /100 | #177 | Average 9.0% |
| Immigrants | Cameroon | 47.1 /100 | #178 | Average 9.0% |
Demographics Similar to Arapaho by Family Poverty
In terms of family poverty, the demographic groups most similar to Arapaho are Immigrants from Honduras (12.7%, a difference of 0.10%), Menominee (12.7%, a difference of 0.65%), Immigrants from Dominica (12.7%, a difference of 0.72%), Inupiat (12.5%, a difference of 1.5%), and British West Indian (12.4%, a difference of 2.0%).
| Demographics | Rating | Rank | Family Poverty |
| Kiowa | 0.0 /100 | #314 | Tragic 12.2% |
| Immigrants | Mexico | 0.0 /100 | #315 | Tragic 12.3% |
| Hondurans | 0.0 /100 | #316 | Tragic 12.4% |
| Immigrants | Grenada | 0.0 /100 | #317 | Tragic 12.4% |
| U.S. Virgin Islanders | 0.0 /100 | #318 | Tragic 12.4% |
| British West Indians | 0.0 /100 | #319 | Tragic 12.4% |
| Inupiat | 0.0 /100 | #320 | Tragic 12.5% |
| Arapaho | 0.0 /100 | #321 | Tragic 12.7% |
| Immigrants | Honduras | 0.0 /100 | #322 | Tragic 12.7% |
| Menominee | 0.0 /100 | #323 | Tragic 12.7% |
| Immigrants | Dominica | 0.0 /100 | #324 | Tragic 12.7% |
| Paiute | 0.0 /100 | #325 | Tragic 13.0% |
| Colville | 0.0 /100 | #326 | Tragic 13.0% |
| Yakama | 0.0 /100 | #327 | Tragic 13.1% |
| Central American Indians | 0.0 /100 | #328 | Tragic 13.3% |