Salvadoran vs Ghanaian No Schooling Completed
COMPARE
Salvadoran
Ghanaian
No Schooling Completed
No Schooling Completed Comparison
Salvadorans
Ghanaians
3.7%
NO SCHOOLING COMPLETED
0.0/ 100
METRIC RATING
343rd/ 347
METRIC RANK
2.6%
NO SCHOOLING COMPLETED
0.1/ 100
METRIC RATING
274th/ 347
METRIC RANK
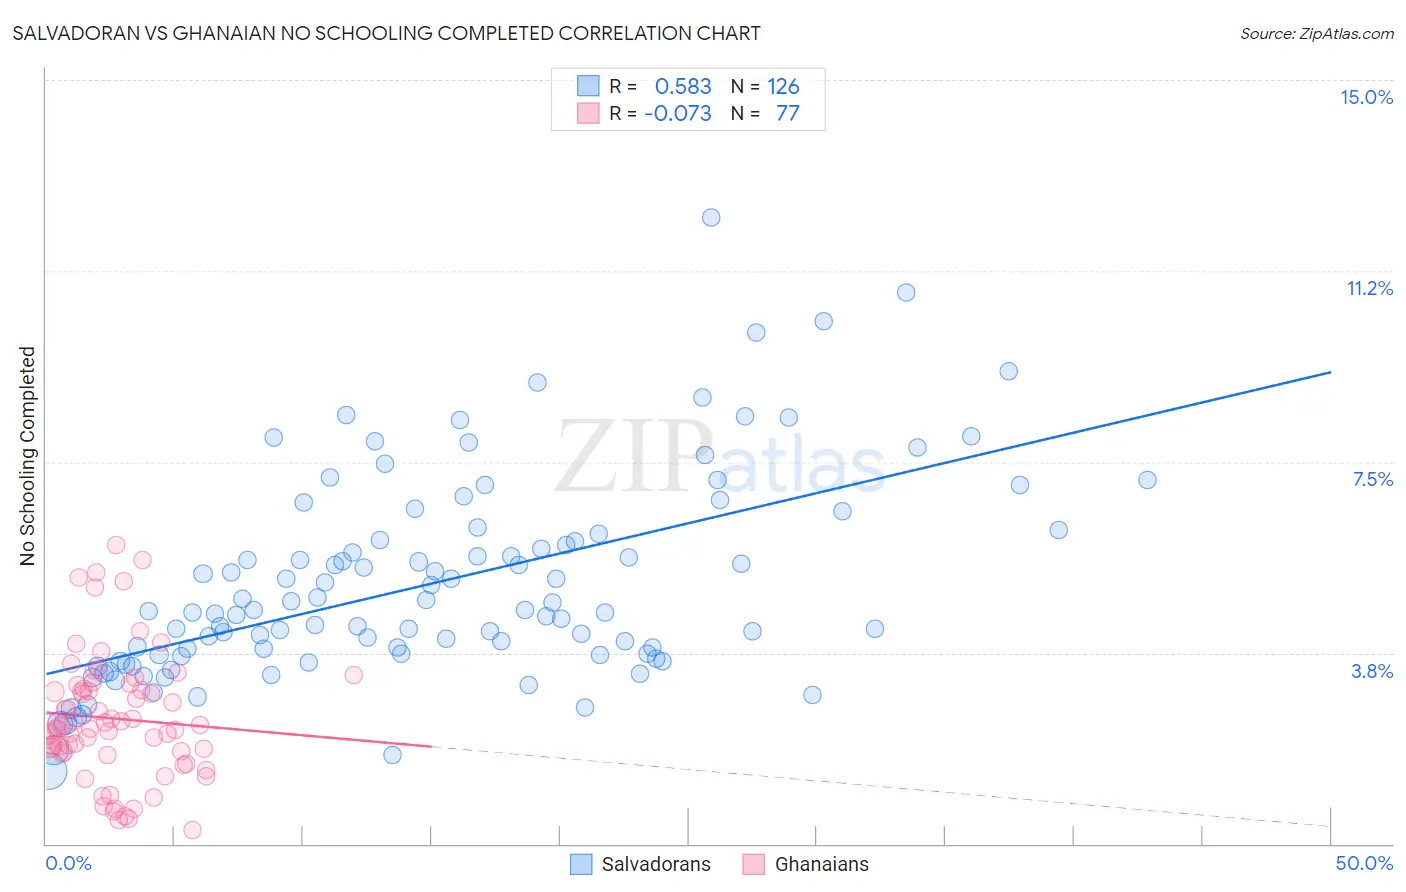
Salvadoran vs Ghanaian No Schooling Completed Correlation Chart
The statistical analysis conducted on geographies consisting of 395,950,136 people shows a substantial positive correlation between the proportion of Salvadorans and percentage of population with no schooling in the United States with a correlation coefficient (R) of 0.583 and weighted average of 3.7%. Similarly, the statistical analysis conducted on geographies consisting of 189,718,385 people shows a slight negative correlation between the proportion of Ghanaians and percentage of population with no schooling in the United States with a correlation coefficient (R) of -0.073 and weighted average of 2.6%, a difference of 46.4%.
No Schooling Completed Correlation Summary
| Measurement | Salvadoran | Ghanaian |
| Minimum | 1.4% | 0.26% |
| Maximum | 12.3% | 5.9% |
| Range | 10.9% | 5.6% |
| Mean | 5.1% | 2.5% |
| Median | 4.6% | 2.3% |
| Interquartile 25% (IQ1) | 3.7% | 1.8% |
| Interquartile 75% (IQ3) | 6.0% | 3.1% |
| Interquartile Range (IQR) | 2.3% | 1.3% |
| Standard Deviation (Sample) | 2.0% | 1.2% |
| Standard Deviation (Population) | 2.0% | 1.2% |
Similar Demographics by No Schooling Completed
Demographics Similar to Salvadorans by No Schooling Completed
In terms of no schooling completed, the demographic groups most similar to Salvadorans are Nepalese (3.8%, a difference of 1.7%), Immigrants from Mexico (3.6%, a difference of 2.8%), Immigrants from El Salvador (3.9%, a difference of 3.5%), Immigrants from Central America (3.6%, a difference of 3.6%), and Immigrants from Guatemala (3.6%, a difference of 4.7%).
| Demographics | Rating | Rank | No Schooling Completed |
| Immigrants | Dominican Republic | 0.0 /100 | #333 | Tragic 3.4% |
| Guatemalans | 0.0 /100 | #334 | Tragic 3.5% |
| Immigrants | Cambodia | 0.0 /100 | #335 | Tragic 3.5% |
| Immigrants | Fiji | 0.0 /100 | #336 | Tragic 3.5% |
| Immigrants | Cabo Verde | 0.0 /100 | #337 | Tragic 3.5% |
| Bangladeshis | 0.0 /100 | #338 | Tragic 3.5% |
| Yakama | 0.0 /100 | #339 | Tragic 3.6% |
| Immigrants | Guatemala | 0.0 /100 | #340 | Tragic 3.6% |
| Immigrants | Central America | 0.0 /100 | #341 | Tragic 3.6% |
| Immigrants | Mexico | 0.0 /100 | #342 | Tragic 3.6% |
| Salvadorans | 0.0 /100 | #343 | Tragic 3.7% |
| Nepalese | 0.0 /100 | #344 | Tragic 3.8% |
| Immigrants | El Salvador | 0.0 /100 | #345 | Tragic 3.9% |
| Immigrants | Yemen | 0.0 /100 | #346 | Tragic 4.1% |
| Spanish American Indians | 0.0 /100 | #347 | Tragic 4.2% |
Demographics Similar to Ghanaians by No Schooling Completed
In terms of no schooling completed, the demographic groups most similar to Ghanaians are Immigrants from China (2.6%, a difference of 0.18%), Immigrants from Cameroon (2.5%, a difference of 0.37%), Immigrants from Western Africa (2.6%, a difference of 0.74%), Immigrants from Philippines (2.6%, a difference of 0.80%), and Immigrants from Uzbekistan (2.6%, a difference of 1.0%).
| Demographics | Rating | Rank | No Schooling Completed |
| Yuman | 0.4 /100 | #267 | Tragic 2.5% |
| Taiwanese | 0.3 /100 | #268 | Tragic 2.5% |
| Immigrants | Nigeria | 0.2 /100 | #269 | Tragic 2.5% |
| Immigrants | Peru | 0.2 /100 | #270 | Tragic 2.5% |
| Cubans | 0.2 /100 | #271 | Tragic 2.5% |
| Immigrants | Bolivia | 0.2 /100 | #272 | Tragic 2.5% |
| Immigrants | Cameroon | 0.1 /100 | #273 | Tragic 2.5% |
| Ghanaians | 0.1 /100 | #274 | Tragic 2.6% |
| Immigrants | China | 0.1 /100 | #275 | Tragic 2.6% |
| Immigrants | Western Africa | 0.1 /100 | #276 | Tragic 2.6% |
| Immigrants | Philippines | 0.1 /100 | #277 | Tragic 2.6% |
| Immigrants | Uzbekistan | 0.1 /100 | #278 | Tragic 2.6% |
| Barbadians | 0.1 /100 | #279 | Tragic 2.6% |
| Trinidadians and Tobagonians | 0.1 /100 | #280 | Tragic 2.6% |
| Afghans | 0.1 /100 | #281 | Tragic 2.6% |