Romanian vs Osage 4th Grade
COMPARE
Romanian
Osage
4th Grade
4th Grade Comparison
Romanians
Osage
97.9%
4TH GRADE
98.4/ 100
METRIC RATING
96th/ 347
METRIC RANK
98.0%
4TH GRADE
99.2/ 100
METRIC RATING
80th/ 347
METRIC RANK
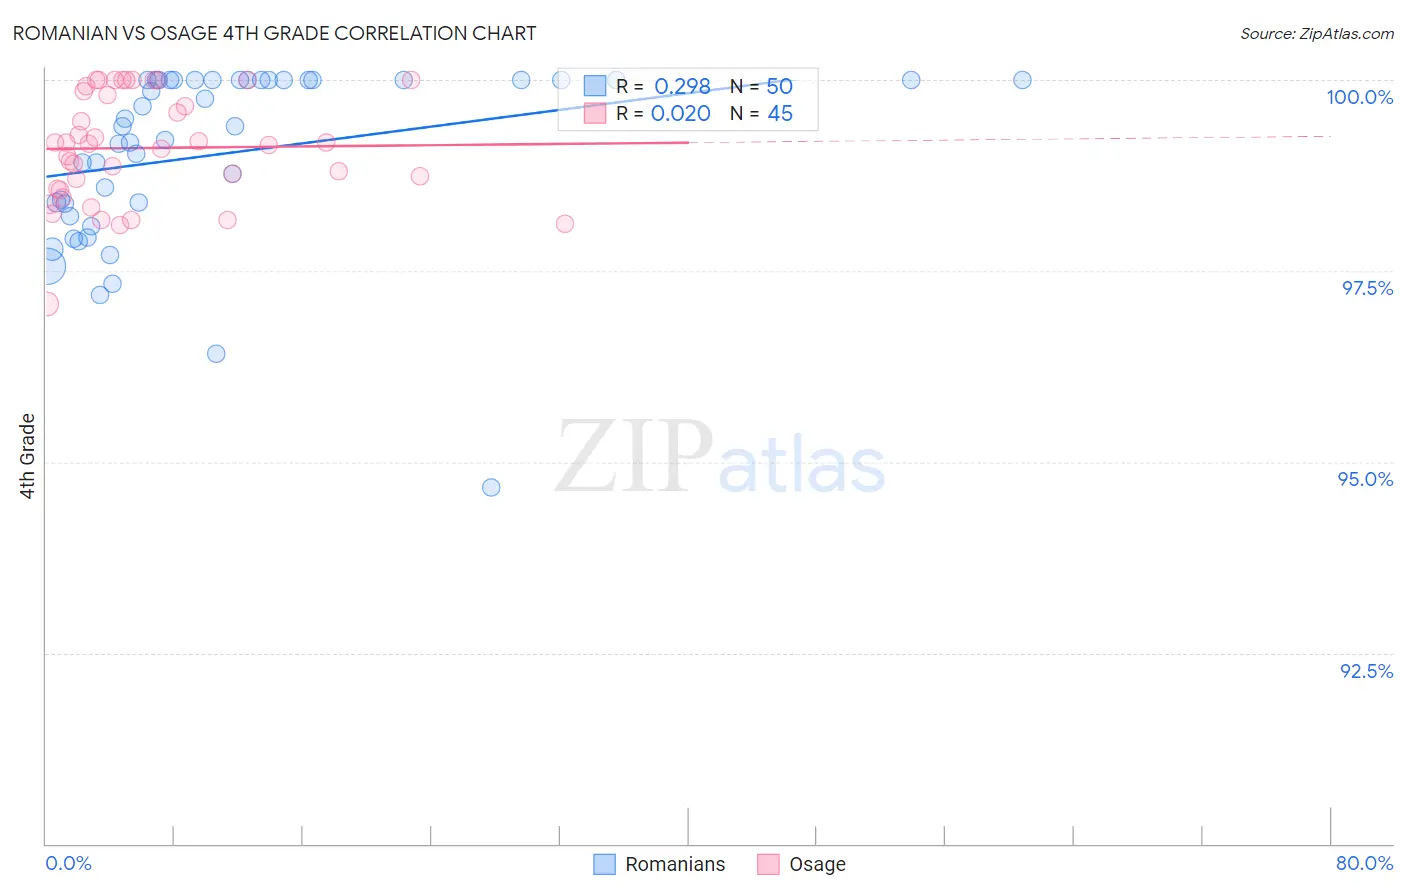
Romanian vs Osage 4th Grade Correlation Chart
The statistical analysis conducted on geographies consisting of 377,904,438 people shows a weak positive correlation between the proportion of Romanians and percentage of population with at least 4th grade education in the United States with a correlation coefficient (R) of 0.298 and weighted average of 97.9%. Similarly, the statistical analysis conducted on geographies consisting of 91,808,929 people shows no correlation between the proportion of Osage and percentage of population with at least 4th grade education in the United States with a correlation coefficient (R) of 0.020 and weighted average of 98.0%, a difference of 0.070%.
4th Grade Correlation Summary
| Measurement | Romanian | Osage |
| Minimum | 94.7% | 97.1% |
| Maximum | 100.0% | 100.0% |
| Range | 5.3% | 2.9% |
| Mean | 99.0% | 99.1% |
| Median | 99.4% | 99.2% |
| Interquartile 25% (IQ1) | 98.4% | 98.6% |
| Interquartile 75% (IQ3) | 100.0% | 99.9% |
| Interquartile Range (IQR) | 1.6% | 1.3% |
| Standard Deviation (Sample) | 1.2% | 0.72% |
| Standard Deviation (Population) | 1.1% | 0.71% |
Demographics Similar to Romanians and Osage by 4th Grade
In terms of 4th grade, the demographic groups most similar to Romanians are Immigrants from Germany (97.9%, a difference of 0.0%), Cheyenne (97.9%, a difference of 0.0%), South African (97.9%, a difference of 0.010%), Immigrants from South Africa (97.9%, a difference of 0.020%), and Delaware (97.9%, a difference of 0.020%). Similarly, the demographic groups most similar to Osage are Ukrainian (98.0%, a difference of 0.0%), Immigrants from England (98.0%, a difference of 0.010%), Immigrants from India (98.0%, a difference of 0.010%), Icelander (98.0%, a difference of 0.010%), and Immigrants from Belgium (97.9%, a difference of 0.020%).
| Demographics | Rating | Rank | 4th Grade |
| Immigrants | England | 99.3 /100 | #78 | Exceptional 98.0% |
| Ukrainians | 99.2 /100 | #79 | Exceptional 98.0% |
| Osage | 99.2 /100 | #80 | Exceptional 98.0% |
| Immigrants | India | 99.1 /100 | #81 | Exceptional 98.0% |
| Icelanders | 99.1 /100 | #82 | Exceptional 98.0% |
| Immigrants | Belgium | 99.0 /100 | #83 | Exceptional 97.9% |
| Cypriots | 98.9 /100 | #84 | Exceptional 97.9% |
| Potawatomi | 98.9 /100 | #85 | Exceptional 97.9% |
| Immigrants | Australia | 98.8 /100 | #86 | Exceptional 97.9% |
| Zimbabweans | 98.8 /100 | #87 | Exceptional 97.9% |
| Immigrants | South Africa | 98.8 /100 | #88 | Exceptional 97.9% |
| Delaware | 98.8 /100 | #89 | Exceptional 97.9% |
| Immigrants | Denmark | 98.7 /100 | #90 | Exceptional 97.9% |
| Immigrants | Sweden | 98.7 /100 | #91 | Exceptional 97.9% |
| Immigrants | Western Europe | 98.7 /100 | #92 | Exceptional 97.9% |
| Immigrants | Ireland | 98.7 /100 | #93 | Exceptional 97.9% |
| Shoshone | 98.7 /100 | #94 | Exceptional 97.9% |
| Immigrants | Germany | 98.5 /100 | #95 | Exceptional 97.9% |
| Romanians | 98.4 /100 | #96 | Exceptional 97.9% |
| Cheyenne | 98.4 /100 | #97 | Exceptional 97.9% |
| South Africans | 98.2 /100 | #98 | Exceptional 97.9% |