Romanian vs Slovene Single Male Poverty
COMPARE
Romanian
Slovene
Single Male Poverty
Single Male Poverty Comparison
Romanians
Slovenes
12.5%
SINGLE MALE POVERTY
86.4/ 100
METRIC RATING
126th/ 347
METRIC RANK
13.0%
SINGLE MALE POVERTY
21.6/ 100
METRIC RATING
200th/ 347
METRIC RANK
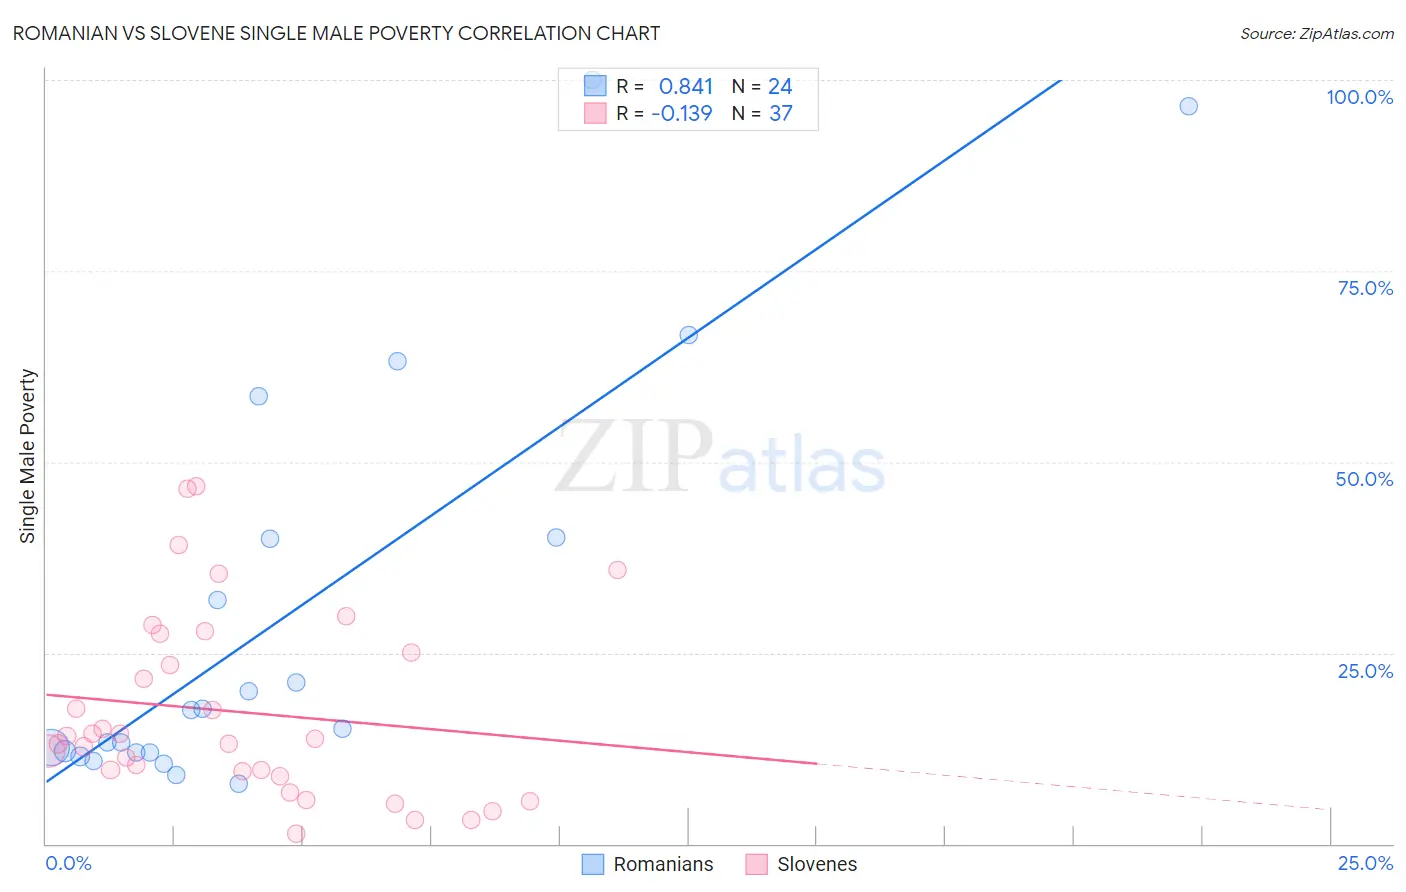
Romanian vs Slovene Single Male Poverty Correlation Chart
The statistical analysis conducted on geographies consisting of 331,496,845 people shows a very strong positive correlation between the proportion of Romanians and poverty level among single males in the United States with a correlation coefficient (R) of 0.841 and weighted average of 12.5%. Similarly, the statistical analysis conducted on geographies consisting of 233,782,721 people shows a poor negative correlation between the proportion of Slovenes and poverty level among single males in the United States with a correlation coefficient (R) of -0.139 and weighted average of 13.0%, a difference of 4.2%.
Single Male Poverty Correlation Summary
| Measurement | Romanian | Slovene |
| Minimum | 7.9% | 1.3% |
| Maximum | 100.0% | 46.9% |
| Range | 92.1% | 45.6% |
| Mean | 29.7% | 17.3% |
| Median | 16.2% | 13.7% |
| Interquartile 25% (IQ1) | 12.0% | 9.2% |
| Interquartile 75% (IQ3) | 40.1% | 26.2% |
| Interquartile Range (IQR) | 28.1% | 17.1% |
| Standard Deviation (Sample) | 27.5% | 12.1% |
| Standard Deviation (Population) | 26.9% | 12.0% |
Similar Demographics by Single Male Poverty
Demographics Similar to Romanians by Single Male Poverty
In terms of single male poverty, the demographic groups most similar to Romanians are Immigrants from Netherlands (12.5%, a difference of 0.010%), Ecuadorian (12.5%, a difference of 0.050%), Immigrants from Jordan (12.5%, a difference of 0.080%), Immigrants from Sierra Leone (12.5%, a difference of 0.090%), and Russian (12.5%, a difference of 0.11%).
| Demographics | Rating | Rank | Single Male Poverty |
| Immigrants | Albania | 90.3 /100 | #119 | Exceptional 12.4% |
| Venezuelans | 89.4 /100 | #120 | Excellent 12.4% |
| Icelanders | 88.2 /100 | #121 | Excellent 12.5% |
| Serbians | 87.9 /100 | #122 | Excellent 12.5% |
| Immigrants | Kenya | 87.6 /100 | #123 | Excellent 12.5% |
| Russians | 87.3 /100 | #124 | Excellent 12.5% |
| Immigrants | Jordan | 87.1 /100 | #125 | Excellent 12.5% |
| Romanians | 86.4 /100 | #126 | Excellent 12.5% |
| Immigrants | Netherlands | 86.2 /100 | #127 | Excellent 12.5% |
| Ecuadorians | 85.9 /100 | #128 | Excellent 12.5% |
| Immigrants | Sierra Leone | 85.5 /100 | #129 | Excellent 12.5% |
| Immigrants | Nicaragua | 84.8 /100 | #130 | Excellent 12.5% |
| Immigrants | Northern Europe | 83.7 /100 | #131 | Excellent 12.5% |
| Salvadorans | 83.7 /100 | #132 | Excellent 12.5% |
| Immigrants | Western Asia | 83.4 /100 | #133 | Excellent 12.5% |
Demographics Similar to Slovenes by Single Male Poverty
In terms of single male poverty, the demographic groups most similar to Slovenes are Trinidadian and Tobagonian (13.0%, a difference of 0.010%), Immigrants from Norway (13.0%, a difference of 0.020%), Lithuanian (13.0%, a difference of 0.040%), Basque (13.0%, a difference of 0.070%), and Immigrants from Bangladesh (13.0%, a difference of 0.10%).
| Demographics | Rating | Rank | Single Male Poverty |
| Immigrants | South Africa | 26.1 /100 | #193 | Fair 13.0% |
| Liberians | 25.2 /100 | #194 | Fair 13.0% |
| Immigrants | England | 23.4 /100 | #195 | Fair 13.0% |
| Immigrants | Grenada | 23.1 /100 | #196 | Fair 13.0% |
| Immigrants | Laos | 23.1 /100 | #197 | Fair 13.0% |
| Lithuanians | 22.1 /100 | #198 | Fair 13.0% |
| Immigrants | Norway | 21.8 /100 | #199 | Fair 13.0% |
| Slovenes | 21.6 /100 | #200 | Fair 13.0% |
| Trinidadians and Tobagonians | 21.4 /100 | #201 | Fair 13.0% |
| Basques | 20.7 /100 | #202 | Fair 13.0% |
| Immigrants | Bangladesh | 20.4 /100 | #203 | Fair 13.0% |
| Estonians | 20.3 /100 | #204 | Fair 13.0% |
| Poles | 19.3 /100 | #205 | Poor 13.0% |
| Northern Europeans | 18.9 /100 | #206 | Poor 13.0% |
| Sudanese | 17.7 /100 | #207 | Poor 13.1% |