Romanian vs British Single Mother Households
COMPARE
Romanian
British
Single Mother Households
Single Mother Households Comparison
Romanians
British
5.6%
SINGLE MOTHER HOUSEHOLDS
98.1/ 100
METRIC RATING
77th/ 347
METRIC RANK
5.8%
SINGLE MOTHER HOUSEHOLDS
95.5/ 100
METRIC RATING
110th/ 347
METRIC RANK
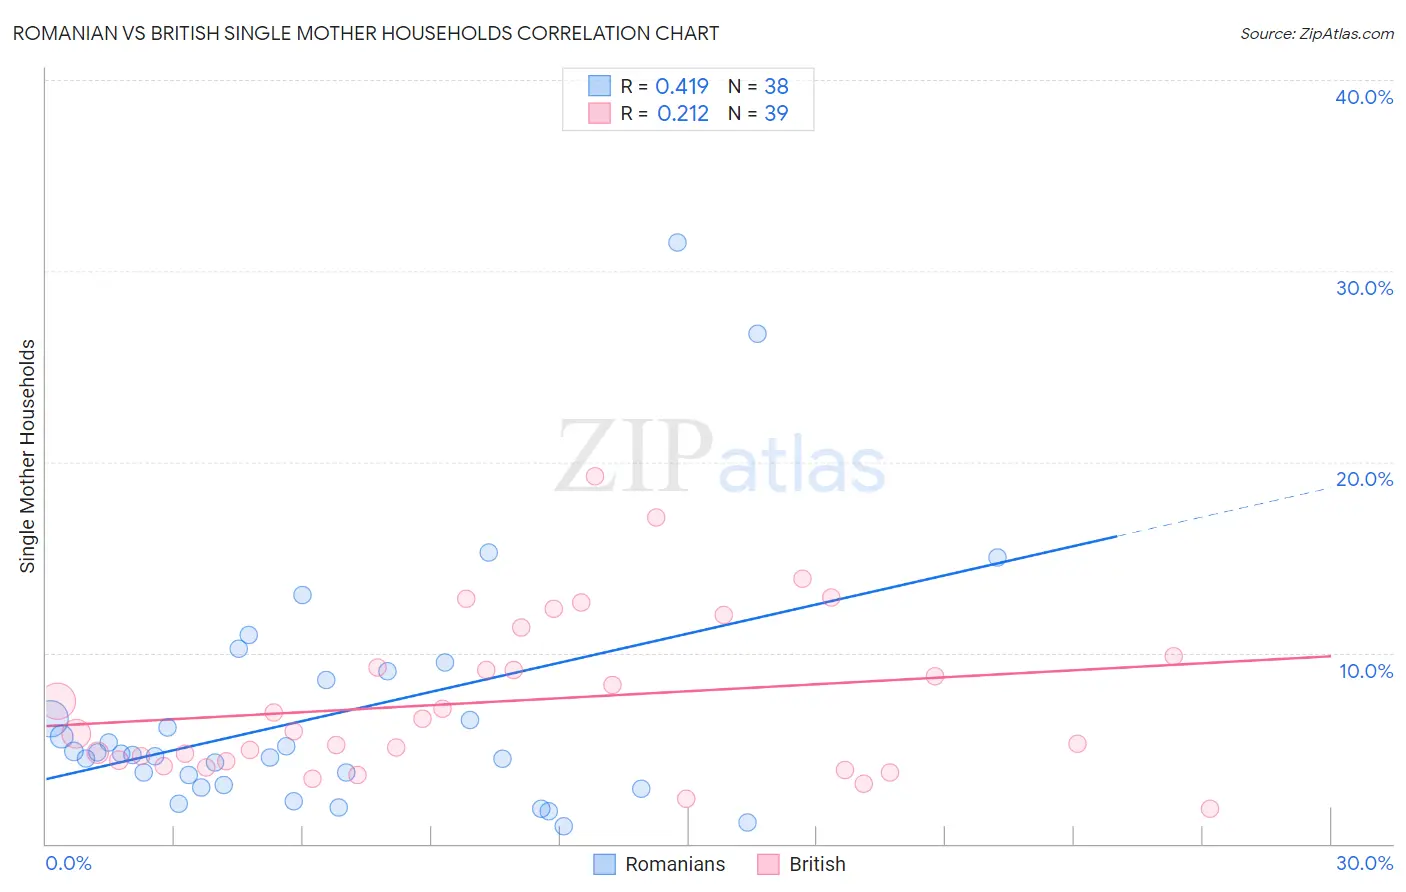
Romanian vs British Single Mother Households Correlation Chart
The statistical analysis conducted on geographies consisting of 376,701,269 people shows a moderate positive correlation between the proportion of Romanians and percentage of single mother households in the United States with a correlation coefficient (R) of 0.419 and weighted average of 5.6%. Similarly, the statistical analysis conducted on geographies consisting of 528,132,597 people shows a weak positive correlation between the proportion of British and percentage of single mother households in the United States with a correlation coefficient (R) of 0.212 and weighted average of 5.8%, a difference of 2.7%.
Single Mother Households Correlation Summary
| Measurement | Romanian | British |
| Minimum | 0.92% | 1.8% |
| Maximum | 31.5% | 19.3% |
| Range | 30.6% | 17.5% |
| Mean | 6.8% | 7.5% |
| Median | 4.7% | 5.9% |
| Interquartile 25% (IQ1) | 3.0% | 4.3% |
| Interquartile 75% (IQ3) | 8.6% | 9.8% |
| Interquartile Range (IQR) | 5.6% | 5.5% |
| Standard Deviation (Sample) | 6.5% | 4.2% |
| Standard Deviation (Population) | 6.4% | 4.1% |
Similar Demographics by Single Mother Households
Demographics Similar to Romanians by Single Mother Households
In terms of single mother households, the demographic groups most similar to Romanians are Swiss (5.6%, a difference of 0.0%), New Zealander (5.6%, a difference of 0.19%), Immigrants from Sri Lanka (5.6%, a difference of 0.21%), Slovene (5.6%, a difference of 0.25%), and Czech (5.6%, a difference of 0.31%).
| Demographics | Rating | Rank | Single Mother Households |
| Immigrants | Eastern Europe | 98.4 /100 | #70 | Exceptional 5.6% |
| Immigrants | Kazakhstan | 98.4 /100 | #71 | Exceptional 5.6% |
| Immigrants | Netherlands | 98.4 /100 | #72 | Exceptional 5.6% |
| Immigrants | Asia | 98.4 /100 | #73 | Exceptional 5.6% |
| Immigrants | North America | 98.3 /100 | #74 | Exceptional 5.6% |
| Slovenes | 98.3 /100 | #75 | Exceptional 5.6% |
| New Zealanders | 98.2 /100 | #76 | Exceptional 5.6% |
| Romanians | 98.1 /100 | #77 | Exceptional 5.6% |
| Swiss | 98.1 /100 | #78 | Exceptional 5.6% |
| Immigrants | Sri Lanka | 98.0 /100 | #79 | Exceptional 5.6% |
| Czechs | 97.9 /100 | #80 | Exceptional 5.6% |
| Immigrants | Moldova | 97.9 /100 | #81 | Exceptional 5.6% |
| Immigrants | Malaysia | 97.8 /100 | #82 | Exceptional 5.7% |
| Immigrants | Hungary | 97.8 /100 | #83 | Exceptional 5.7% |
| Carpatho Rusyns | 97.7 /100 | #84 | Exceptional 5.7% |
Demographics Similar to British by Single Mother Households
In terms of single mother households, the demographic groups most similar to British are Immigrants from England (5.8%, a difference of 0.030%), Immigrants from Kuwait (5.8%, a difference of 0.070%), Immigrants from Western Europe (5.8%, a difference of 0.090%), Mongolian (5.8%, a difference of 0.14%), and Immigrants from Italy (5.8%, a difference of 0.18%).
| Demographics | Rating | Rank | Single Mother Households |
| Scottish | 96.2 /100 | #103 | Exceptional 5.8% |
| Northern Europeans | 96.2 /100 | #104 | Exceptional 5.8% |
| Taiwanese | 96.1 /100 | #105 | Exceptional 5.8% |
| Immigrants | Ukraine | 95.9 /100 | #106 | Exceptional 5.8% |
| Paraguayans | 95.8 /100 | #107 | Exceptional 5.8% |
| Immigrants | Italy | 95.8 /100 | #108 | Exceptional 5.8% |
| Immigrants | Western Europe | 95.7 /100 | #109 | Exceptional 5.8% |
| British | 95.5 /100 | #110 | Exceptional 5.8% |
| Immigrants | England | 95.5 /100 | #111 | Exceptional 5.8% |
| Immigrants | Kuwait | 95.4 /100 | #112 | Exceptional 5.8% |
| Mongolians | 95.3 /100 | #113 | Exceptional 5.8% |
| Dutch | 95.1 /100 | #114 | Exceptional 5.8% |
| Irish | 94.8 /100 | #115 | Exceptional 5.8% |
| Pennsylvania Germans | 94.7 /100 | #116 | Exceptional 5.8% |
| Bolivians | 94.6 /100 | #117 | Exceptional 5.8% |