Romanian vs Immigrants from Bangladesh Family Poverty
COMPARE
Romanian
Immigrants from Bangladesh
Family Poverty
Family Poverty Comparison
Romanians
Immigrants from Bangladesh
8.2%
FAMILY POVERTY
94.7/ 100
METRIC RATING
110th/ 347
METRIC RANK
11.7%
FAMILY POVERTY
0.0/ 100
METRIC RATING
300th/ 347
METRIC RANK
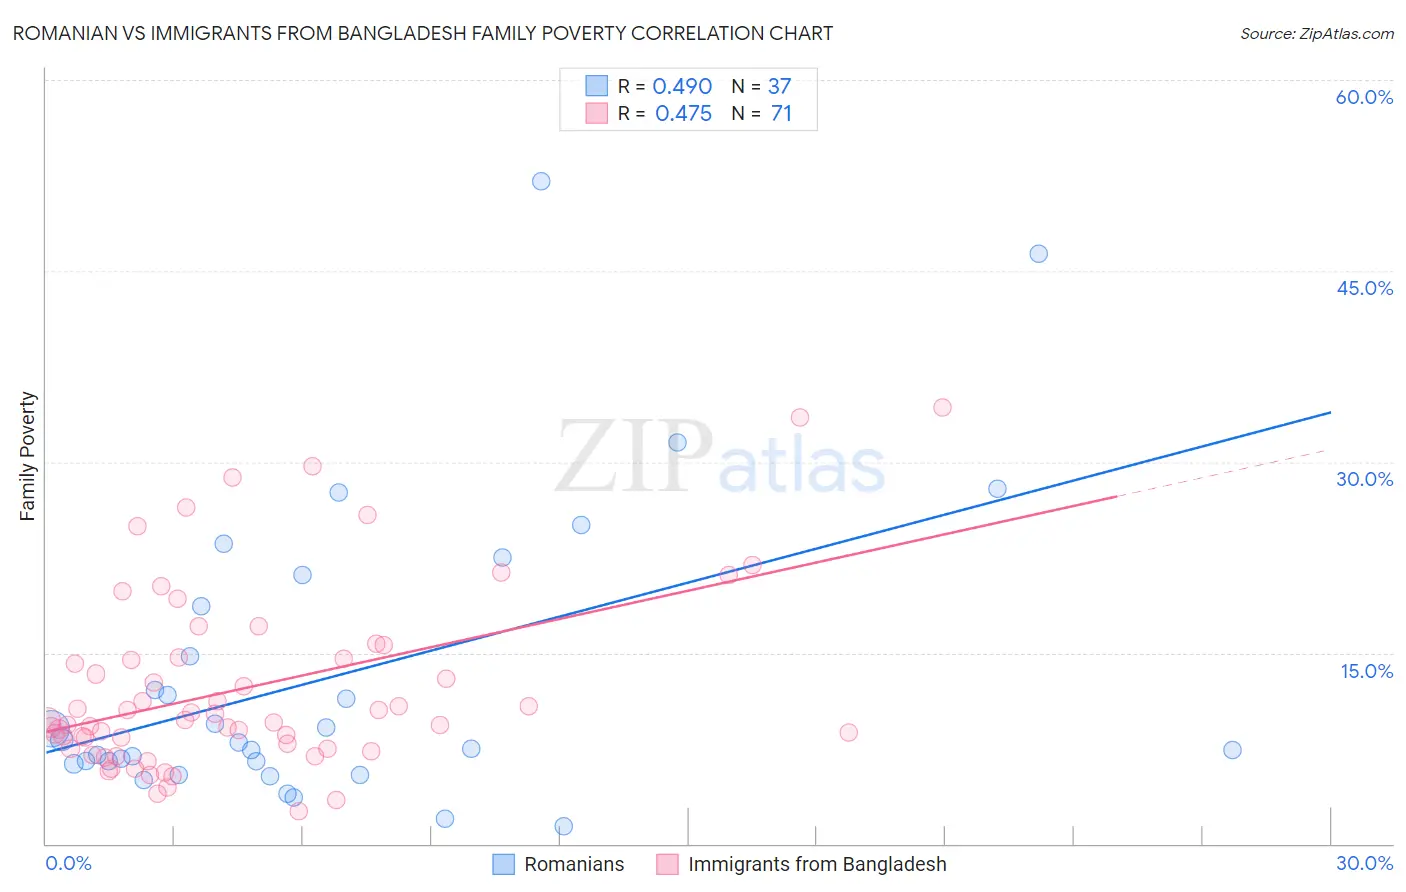
Romanian vs Immigrants from Bangladesh Family Poverty Correlation Chart
The statistical analysis conducted on geographies consisting of 376,889,400 people shows a moderate positive correlation between the proportion of Romanians and poverty level among families in the United States with a correlation coefficient (R) of 0.490 and weighted average of 8.2%. Similarly, the statistical analysis conducted on geographies consisting of 203,403,865 people shows a moderate positive correlation between the proportion of Immigrants from Bangladesh and poverty level among families in the United States with a correlation coefficient (R) of 0.475 and weighted average of 11.7%, a difference of 43.2%.
Family Poverty Correlation Summary
| Measurement | Romanian | Immigrants from Bangladesh |
| Minimum | 1.4% | 2.5% |
| Maximum | 52.0% | 34.2% |
| Range | 50.6% | 31.7% |
| Mean | 13.2% | 12.3% |
| Median | 7.9% | 9.7% |
| Interquartile 25% (IQ1) | 6.4% | 7.5% |
| Interquartile 75% (IQ3) | 19.9% | 14.6% |
| Interquartile Range (IQR) | 13.5% | 7.1% |
| Standard Deviation (Sample) | 11.8% | 7.2% |
| Standard Deviation (Population) | 11.6% | 7.1% |
Similar Demographics by Family Poverty
Demographics Similar to Romanians by Family Poverty
In terms of family poverty, the demographic groups most similar to Romanians are Taiwanese (8.2%, a difference of 0.060%), Jordanian (8.2%, a difference of 0.090%), Immigrants from France (8.2%, a difference of 0.16%), Basque (8.1%, a difference of 0.18%), and French Canadian (8.1%, a difference of 0.27%).
| Demographics | Rating | Rank | Family Poverty |
| Immigrants | Eastern Europe | 95.6 /100 | #103 | Exceptional 8.1% |
| Slavs | 95.6 /100 | #104 | Exceptional 8.1% |
| Laotians | 95.6 /100 | #105 | Exceptional 8.1% |
| Egyptians | 95.1 /100 | #106 | Exceptional 8.1% |
| French Canadians | 95.0 /100 | #107 | Exceptional 8.1% |
| Basques | 94.9 /100 | #108 | Exceptional 8.1% |
| Jordanians | 94.8 /100 | #109 | Exceptional 8.2% |
| Romanians | 94.7 /100 | #110 | Exceptional 8.2% |
| Taiwanese | 94.6 /100 | #111 | Exceptional 8.2% |
| Immigrants | France | 94.4 /100 | #112 | Exceptional 8.2% |
| Canadians | 94.2 /100 | #113 | Exceptional 8.2% |
| Immigrants | Zimbabwe | 94.0 /100 | #114 | Exceptional 8.2% |
| Immigrants | Israel | 93.5 /100 | #115 | Exceptional 8.2% |
| South Africans | 93.4 /100 | #116 | Exceptional 8.2% |
| Immigrants | Russia | 93.2 /100 | #117 | Exceptional 8.2% |
Demographics Similar to Immigrants from Bangladesh by Family Poverty
In terms of family poverty, the demographic groups most similar to Immigrants from Bangladesh are Dutch West Indian (11.7%, a difference of 0.010%), Immigrants from Senegal (11.7%, a difference of 0.11%), Creek (11.7%, a difference of 0.25%), Bahamian (11.7%, a difference of 0.25%), and Guatemalan (11.7%, a difference of 0.29%).
| Demographics | Rating | Rank | Family Poverty |
| Immigrants | Cabo Verde | 0.0 /100 | #293 | Tragic 11.6% |
| Immigrants | St. Vincent and the Grenadines | 0.0 /100 | #294 | Tragic 11.6% |
| Immigrants | Haiti | 0.0 /100 | #295 | Tragic 11.6% |
| Choctaw | 0.0 /100 | #296 | Tragic 11.6% |
| Creek | 0.0 /100 | #297 | Tragic 11.7% |
| Immigrants | Senegal | 0.0 /100 | #298 | Tragic 11.7% |
| Dutch West Indians | 0.0 /100 | #299 | Tragic 11.7% |
| Immigrants | Bangladesh | 0.0 /100 | #300 | Tragic 11.7% |
| Bahamians | 0.0 /100 | #301 | Tragic 11.7% |
| Guatemalans | 0.0 /100 | #302 | Tragic 11.7% |
| Africans | 0.0 /100 | #303 | Tragic 11.8% |
| Immigrants | Latin America | 0.0 /100 | #304 | Tragic 11.8% |
| Mexicans | 0.0 /100 | #305 | Tragic 11.8% |
| Cajuns | 0.0 /100 | #306 | Tragic 11.9% |
| Immigrants | Congo | 0.0 /100 | #307 | Tragic 11.9% |