Puget Sound Salish vs Immigrants from Middle Africa Child Poverty Under the Age of 5
COMPARE
Puget Sound Salish
Immigrants from Middle Africa
Child Poverty Under the Age of 5
Child Poverty Under the Age of 5 Comparison
Puget Sound Salish
Immigrants from Middle Africa
16.0%
CHILD POVERTY UNDER THE AGE OF 5
94.1/ 100
METRIC RATING
113th/ 347
METRIC RANK
19.7%
CHILD POVERTY UNDER THE AGE OF 5
0.4/ 100
METRIC RATING
249th/ 347
METRIC RANK
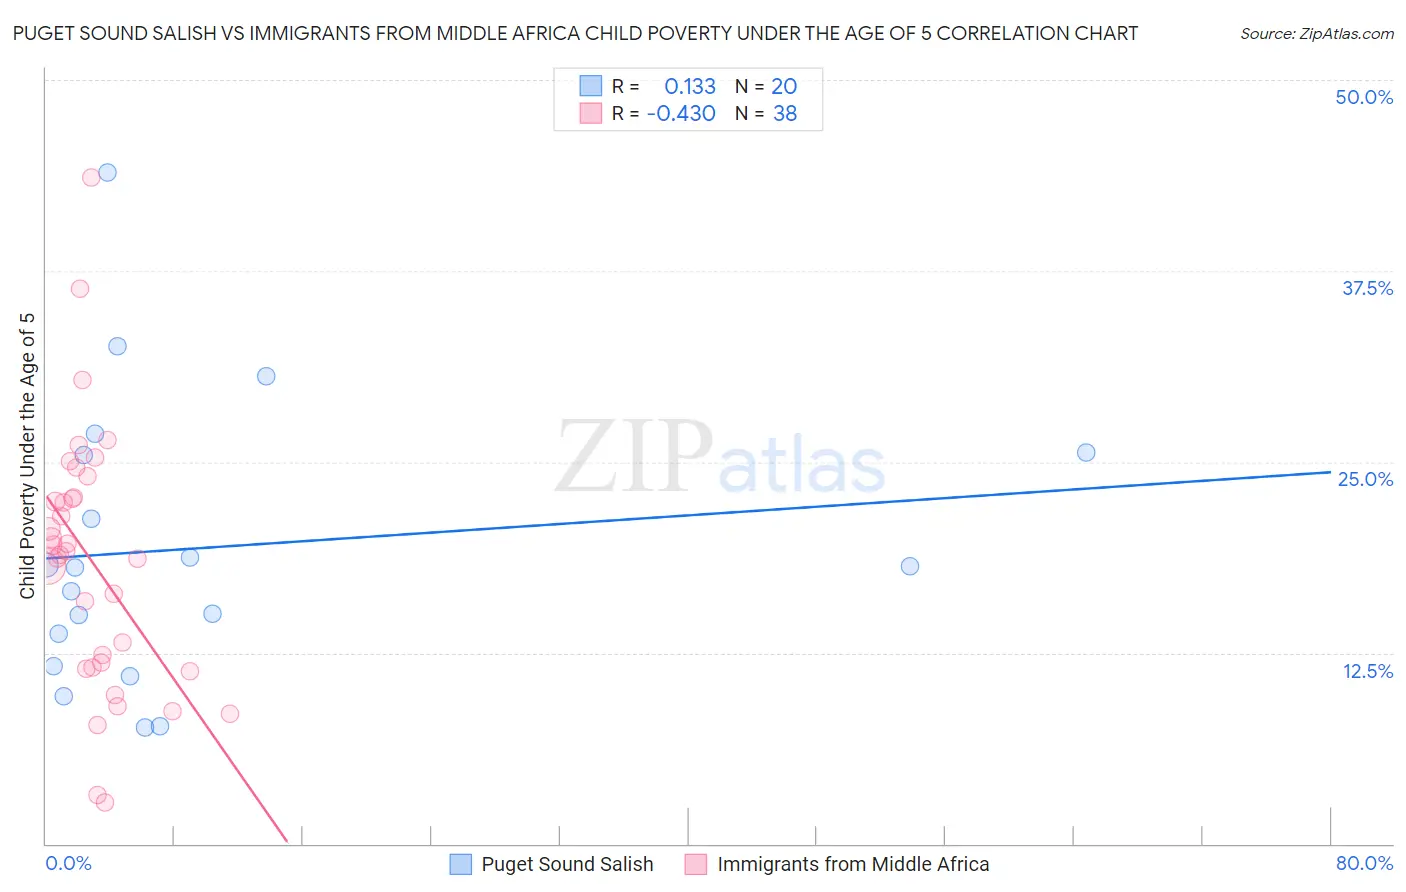
Puget Sound Salish vs Immigrants from Middle Africa Child Poverty Under the Age of 5 Correlation Chart
The statistical analysis conducted on geographies consisting of 45,628,509 people shows a poor positive correlation between the proportion of Puget Sound Salish and poverty level among children under the age of 5 in the United States with a correlation coefficient (R) of 0.133 and weighted average of 16.0%. Similarly, the statistical analysis conducted on geographies consisting of 199,457,822 people shows a moderate negative correlation between the proportion of Immigrants from Middle Africa and poverty level among children under the age of 5 in the United States with a correlation coefficient (R) of -0.430 and weighted average of 19.7%, a difference of 23.4%.
Child Poverty Under the Age of 5 Correlation Summary
| Measurement | Puget Sound Salish | Immigrants from Middle Africa |
| Minimum | 7.6% | 2.7% |
| Maximum | 43.9% | 43.6% |
| Range | 36.3% | 40.9% |
| Mean | 19.4% | 18.4% |
| Median | 18.1% | 19.0% |
| Interquartile 25% (IQ1) | 12.7% | 11.6% |
| Interquartile 75% (IQ3) | 25.6% | 22.6% |
| Interquartile Range (IQR) | 12.9% | 11.1% |
| Standard Deviation (Sample) | 9.2% | 8.5% |
| Standard Deviation (Population) | 9.0% | 8.4% |
Similar Demographics by Child Poverty Under the Age of 5
Demographics Similar to Puget Sound Salish by Child Poverty Under the Age of 5
In terms of child poverty under the age of 5, the demographic groups most similar to Puget Sound Salish are Peruvian (16.0%, a difference of 0.010%), Pakistani (16.0%, a difference of 0.060%), Immigrants from Kuwait (16.0%, a difference of 0.090%), Northern European (16.0%, a difference of 0.10%), and Romanian (16.0%, a difference of 0.10%).
| Demographics | Rating | Rank | Child Poverty Under the Age of 5 |
| Tlingit-Haida | 94.7 /100 | #106 | Exceptional 15.9% |
| Slovenes | 94.4 /100 | #107 | Exceptional 16.0% |
| Immigrants | Brazil | 94.4 /100 | #108 | Exceptional 16.0% |
| Northern Europeans | 94.3 /100 | #109 | Exceptional 16.0% |
| Romanians | 94.3 /100 | #110 | Exceptional 16.0% |
| Pakistanis | 94.2 /100 | #111 | Exceptional 16.0% |
| Peruvians | 94.1 /100 | #112 | Exceptional 16.0% |
| Puget Sound Salish | 94.1 /100 | #113 | Exceptional 16.0% |
| Immigrants | Kuwait | 93.9 /100 | #114 | Exceptional 16.0% |
| Albanians | 93.8 /100 | #115 | Exceptional 16.0% |
| Immigrants | Austria | 93.5 /100 | #116 | Exceptional 16.0% |
| Basques | 93.4 /100 | #117 | Exceptional 16.0% |
| Immigrants | Denmark | 93.4 /100 | #118 | Exceptional 16.0% |
| Immigrants | Jordan | 93.2 /100 | #119 | Exceptional 16.1% |
| Immigrants | Peru | 92.6 /100 | #120 | Exceptional 16.1% |
Demographics Similar to Immigrants from Middle Africa by Child Poverty Under the Age of 5
In terms of child poverty under the age of 5, the demographic groups most similar to Immigrants from Middle Africa are Marshallese (19.7%, a difference of 0.020%), Guyanese (19.7%, a difference of 0.030%), Nonimmigrants (19.7%, a difference of 0.050%), Cree (19.7%, a difference of 0.19%), and Pennsylvania German (19.8%, a difference of 0.22%).
| Demographics | Rating | Rank | Child Poverty Under the Age of 5 |
| Immigrants | Guyana | 0.5 /100 | #242 | Tragic 19.6% |
| Osage | 0.5 /100 | #243 | Tragic 19.6% |
| Immigrants | Ghana | 0.5 /100 | #244 | Tragic 19.6% |
| Immigrants | Western Africa | 0.4 /100 | #245 | Tragic 19.7% |
| Cree | 0.4 /100 | #246 | Tragic 19.7% |
| Guyanese | 0.4 /100 | #247 | Tragic 19.7% |
| Marshallese | 0.4 /100 | #248 | Tragic 19.7% |
| Immigrants | Middle Africa | 0.4 /100 | #249 | Tragic 19.7% |
| Immigrants | Nonimmigrants | 0.4 /100 | #250 | Tragic 19.7% |
| Pennsylvania Germans | 0.3 /100 | #251 | Tragic 19.8% |
| Immigrants | Nicaragua | 0.3 /100 | #252 | Tragic 19.8% |
| Mexican American Indians | 0.3 /100 | #253 | Tragic 19.9% |
| Fijians | 0.3 /100 | #254 | Tragic 19.9% |
| Immigrants | Cuba | 0.2 /100 | #255 | Tragic 19.9% |
| Immigrants | Barbados | 0.2 /100 | #256 | Tragic 20.0% |