Puget Sound Salish vs Immigrants from Honduras Child Poverty Under the Age of 5
COMPARE
Puget Sound Salish
Immigrants from Honduras
Child Poverty Under the Age of 5
Child Poverty Under the Age of 5 Comparison
Puget Sound Salish
Immigrants from Honduras
16.0%
CHILD POVERTY UNDER THE AGE OF 5
94.1/ 100
METRIC RATING
113th/ 347
METRIC RANK
23.5%
CHILD POVERTY UNDER THE AGE OF 5
0.0/ 100
METRIC RATING
321st/ 347
METRIC RANK
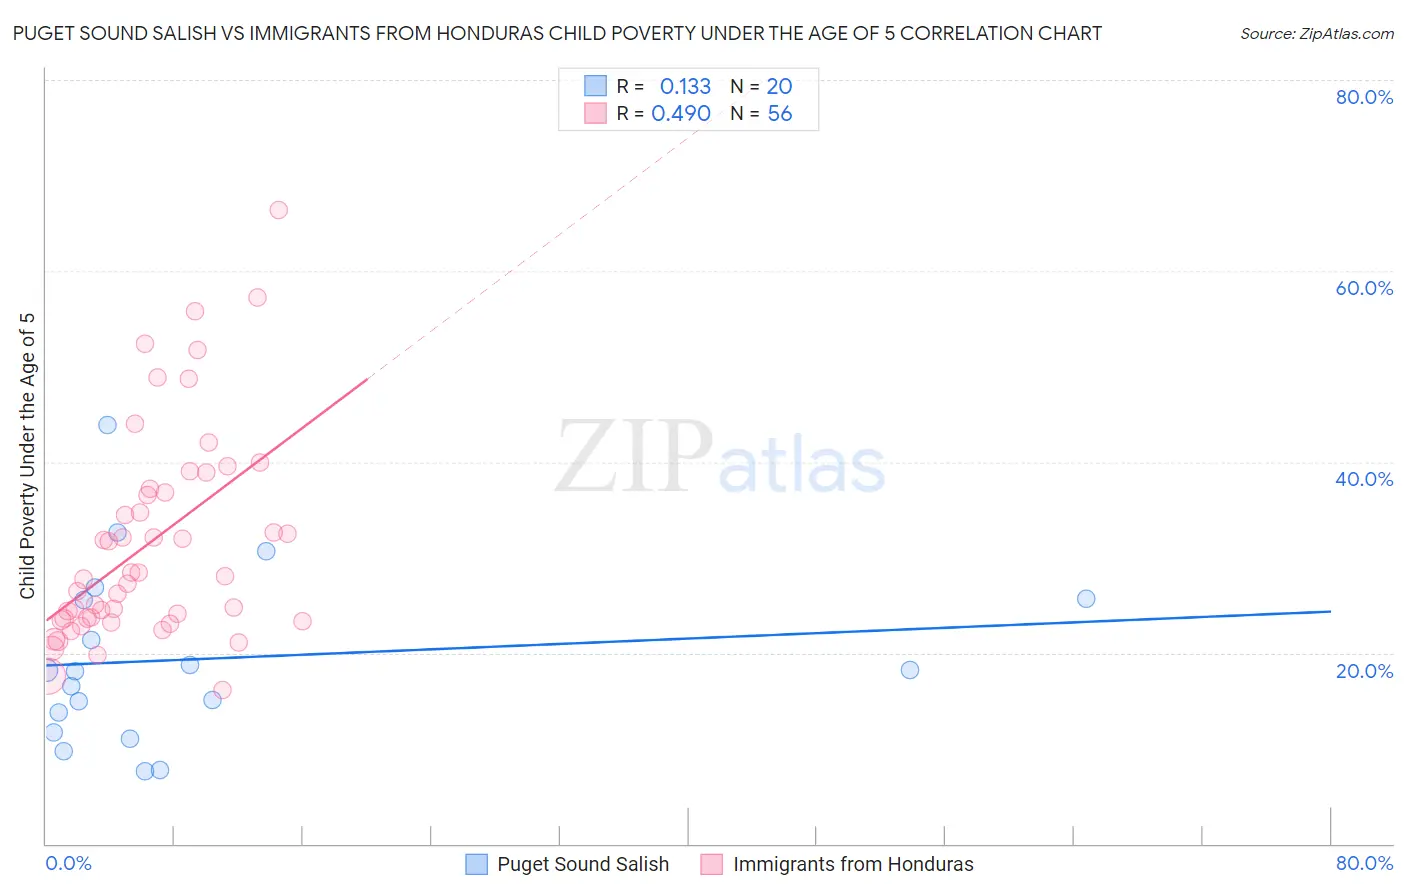
Puget Sound Salish vs Immigrants from Honduras Child Poverty Under the Age of 5 Correlation Chart
The statistical analysis conducted on geographies consisting of 45,628,509 people shows a poor positive correlation between the proportion of Puget Sound Salish and poverty level among children under the age of 5 in the United States with a correlation coefficient (R) of 0.133 and weighted average of 16.0%. Similarly, the statistical analysis conducted on geographies consisting of 316,401,171 people shows a moderate positive correlation between the proportion of Immigrants from Honduras and poverty level among children under the age of 5 in the United States with a correlation coefficient (R) of 0.490 and weighted average of 23.5%, a difference of 46.9%.
Child Poverty Under the Age of 5 Correlation Summary
| Measurement | Puget Sound Salish | Immigrants from Honduras |
| Minimum | 7.6% | 16.1% |
| Maximum | 43.9% | 66.4% |
| Range | 36.3% | 50.2% |
| Mean | 19.4% | 31.5% |
| Median | 18.1% | 27.9% |
| Interquartile 25% (IQ1) | 12.7% | 23.5% |
| Interquartile 75% (IQ3) | 25.6% | 37.0% |
| Interquartile Range (IQR) | 12.9% | 13.5% |
| Standard Deviation (Sample) | 9.2% | 11.0% |
| Standard Deviation (Population) | 9.0% | 10.9% |
Similar Demographics by Child Poverty Under the Age of 5
Demographics Similar to Puget Sound Salish by Child Poverty Under the Age of 5
In terms of child poverty under the age of 5, the demographic groups most similar to Puget Sound Salish are Peruvian (16.0%, a difference of 0.010%), Pakistani (16.0%, a difference of 0.060%), Immigrants from Kuwait (16.0%, a difference of 0.090%), Northern European (16.0%, a difference of 0.10%), and Romanian (16.0%, a difference of 0.10%).
| Demographics | Rating | Rank | Child Poverty Under the Age of 5 |
| Tlingit-Haida | 94.7 /100 | #106 | Exceptional 15.9% |
| Slovenes | 94.4 /100 | #107 | Exceptional 16.0% |
| Immigrants | Brazil | 94.4 /100 | #108 | Exceptional 16.0% |
| Northern Europeans | 94.3 /100 | #109 | Exceptional 16.0% |
| Romanians | 94.3 /100 | #110 | Exceptional 16.0% |
| Pakistanis | 94.2 /100 | #111 | Exceptional 16.0% |
| Peruvians | 94.1 /100 | #112 | Exceptional 16.0% |
| Puget Sound Salish | 94.1 /100 | #113 | Exceptional 16.0% |
| Immigrants | Kuwait | 93.9 /100 | #114 | Exceptional 16.0% |
| Albanians | 93.8 /100 | #115 | Exceptional 16.0% |
| Immigrants | Austria | 93.5 /100 | #116 | Exceptional 16.0% |
| Basques | 93.4 /100 | #117 | Exceptional 16.0% |
| Immigrants | Denmark | 93.4 /100 | #118 | Exceptional 16.0% |
| Immigrants | Jordan | 93.2 /100 | #119 | Exceptional 16.1% |
| Immigrants | Peru | 92.6 /100 | #120 | Exceptional 16.1% |
Demographics Similar to Immigrants from Honduras by Child Poverty Under the Age of 5
In terms of child poverty under the age of 5, the demographic groups most similar to Immigrants from Honduras are Choctaw (23.5%, a difference of 0.030%), Ute (23.5%, a difference of 0.23%), Chippewa (23.4%, a difference of 0.41%), Pueblo (23.7%, a difference of 0.81%), and Dutch West Indian (23.3%, a difference of 0.89%).
| Demographics | Rating | Rank | Child Poverty Under the Age of 5 |
| U.S. Virgin Islanders | 0.0 /100 | #314 | Tragic 23.0% |
| Arapaho | 0.0 /100 | #315 | Tragic 23.1% |
| Yakama | 0.0 /100 | #316 | Tragic 23.1% |
| Menominee | 0.0 /100 | #317 | Tragic 23.3% |
| Dutch West Indians | 0.0 /100 | #318 | Tragic 23.3% |
| Chippewa | 0.0 /100 | #319 | Tragic 23.4% |
| Choctaw | 0.0 /100 | #320 | Tragic 23.5% |
| Immigrants | Honduras | 0.0 /100 | #321 | Tragic 23.5% |
| Ute | 0.0 /100 | #322 | Tragic 23.5% |
| Pueblo | 0.0 /100 | #323 | Tragic 23.7% |
| Paiute | 0.0 /100 | #324 | Tragic 23.8% |
| Immigrants | Congo | 0.0 /100 | #325 | Tragic 23.9% |
| Central American Indians | 0.0 /100 | #326 | Tragic 23.9% |
| Dominicans | 0.0 /100 | #327 | Tragic 24.0% |
| Immigrants | Dominican Republic | 0.0 /100 | #328 | Tragic 24.1% |