Lumbee vs Immigrants from Middle Africa Child Poverty Under the Age of 5
COMPARE
Lumbee
Immigrants from Middle Africa
Child Poverty Under the Age of 5
Child Poverty Under the Age of 5 Comparison
Lumbee
Immigrants from Middle Africa
33.3%
CHILD POVERTY UNDER THE AGE OF 5
0.0/ 100
METRIC RATING
346th/ 347
METRIC RANK
19.7%
CHILD POVERTY UNDER THE AGE OF 5
0.4/ 100
METRIC RATING
249th/ 347
METRIC RANK
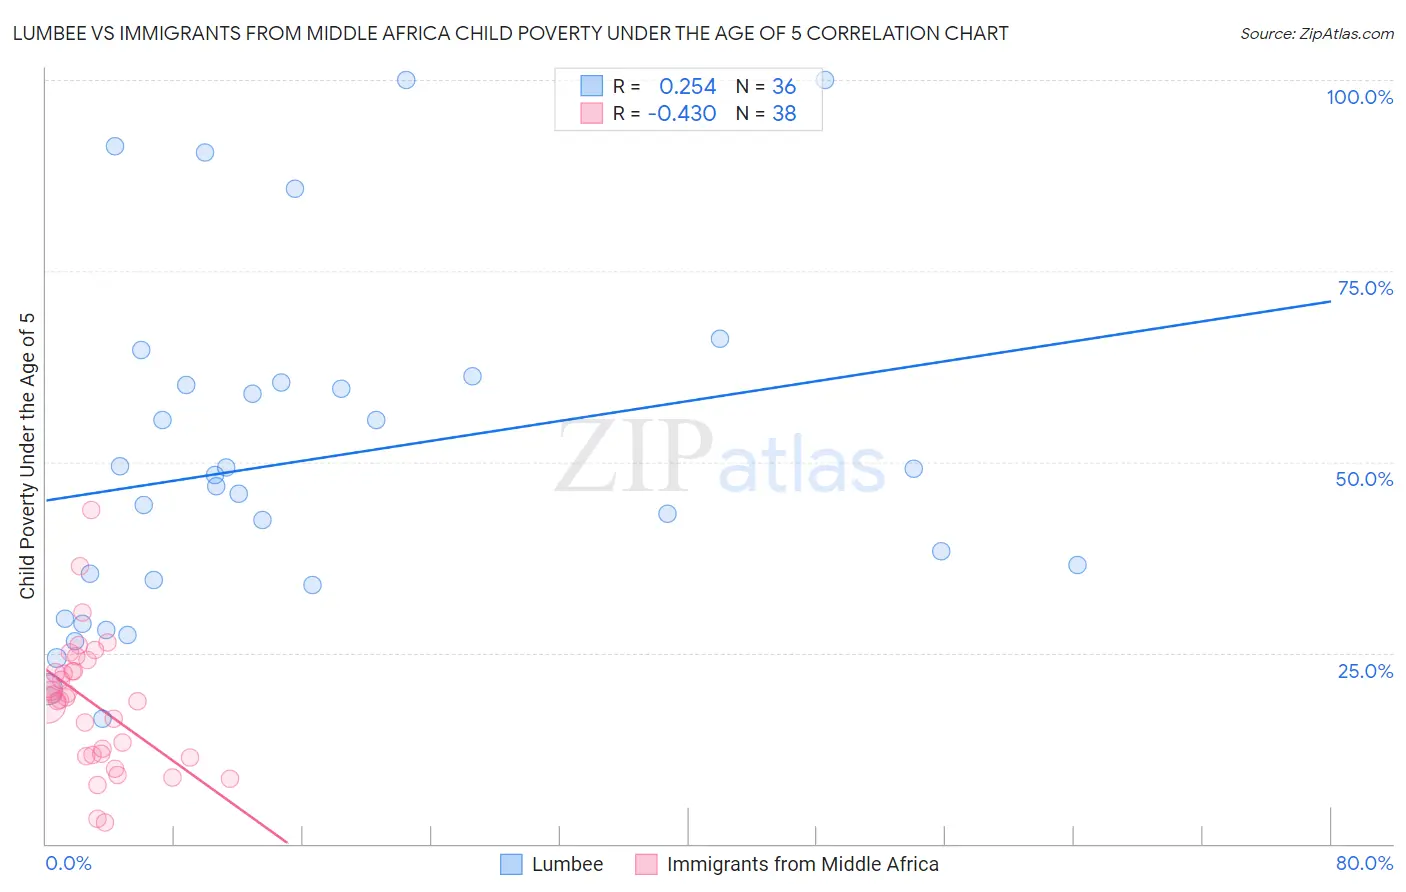
Lumbee vs Immigrants from Middle Africa Child Poverty Under the Age of 5 Correlation Chart
The statistical analysis conducted on geographies consisting of 91,145,286 people shows a weak positive correlation between the proportion of Lumbee and poverty level among children under the age of 5 in the United States with a correlation coefficient (R) of 0.254 and weighted average of 33.3%. Similarly, the statistical analysis conducted on geographies consisting of 199,457,822 people shows a moderate negative correlation between the proportion of Immigrants from Middle Africa and poverty level among children under the age of 5 in the United States with a correlation coefficient (R) of -0.430 and weighted average of 19.7%, a difference of 68.8%.
Child Poverty Under the Age of 5 Correlation Summary
| Measurement | Lumbee | Immigrants from Middle Africa |
| Minimum | 16.3% | 2.7% |
| Maximum | 100.0% | 43.6% |
| Range | 83.7% | 40.9% |
| Mean | 50.2% | 18.4% |
| Median | 47.5% | 19.0% |
| Interquartile 25% (IQ1) | 34.2% | 11.6% |
| Interquartile 75% (IQ3) | 60.3% | 22.6% |
| Interquartile Range (IQR) | 26.1% | 11.1% |
| Standard Deviation (Sample) | 22.0% | 8.5% |
| Standard Deviation (Population) | 21.7% | 8.4% |
Similar Demographics by Child Poverty Under the Age of 5
Demographics Similar to Lumbee by Child Poverty Under the Age of 5
In terms of child poverty under the age of 5, the demographic groups most similar to Lumbee are Puerto Rican (34.5%, a difference of 3.7%), Navajo (31.6%, a difference of 5.4%), Crow (31.0%, a difference of 7.4%), Yuman (29.5%, a difference of 12.7%), and Tohono O'odham (29.5%, a difference of 12.9%).
| Demographics | Rating | Rank | Child Poverty Under the Age of 5 |
| Natives/Alaskans | 0.0 /100 | #333 | Tragic 25.6% |
| Blacks/African Americans | 0.0 /100 | #334 | Tragic 25.7% |
| Colville | 0.0 /100 | #335 | Tragic 25.7% |
| Sioux | 0.0 /100 | #336 | Tragic 26.9% |
| Pima | 0.0 /100 | #337 | Tragic 27.4% |
| Hopi | 0.0 /100 | #338 | Tragic 27.7% |
| Yup'ik | 0.0 /100 | #339 | Tragic 27.7% |
| Cheyenne | 0.0 /100 | #340 | Tragic 28.3% |
| Immigrants | Yemen | 0.0 /100 | #341 | Tragic 29.3% |
| Tohono O'odham | 0.0 /100 | #342 | Tragic 29.5% |
| Yuman | 0.0 /100 | #343 | Tragic 29.5% |
| Crow | 0.0 /100 | #344 | Tragic 31.0% |
| Navajo | 0.0 /100 | #345 | Tragic 31.6% |
| Lumbee | 0.0 /100 | #346 | Tragic 33.3% |
| Puerto Ricans | 0.0 /100 | #347 | Tragic 34.5% |
Demographics Similar to Immigrants from Middle Africa by Child Poverty Under the Age of 5
In terms of child poverty under the age of 5, the demographic groups most similar to Immigrants from Middle Africa are Marshallese (19.7%, a difference of 0.020%), Guyanese (19.7%, a difference of 0.030%), Nonimmigrants (19.7%, a difference of 0.050%), Cree (19.7%, a difference of 0.19%), and Pennsylvania German (19.8%, a difference of 0.22%).
| Demographics | Rating | Rank | Child Poverty Under the Age of 5 |
| Immigrants | Guyana | 0.5 /100 | #242 | Tragic 19.6% |
| Osage | 0.5 /100 | #243 | Tragic 19.6% |
| Immigrants | Ghana | 0.5 /100 | #244 | Tragic 19.6% |
| Immigrants | Western Africa | 0.4 /100 | #245 | Tragic 19.7% |
| Cree | 0.4 /100 | #246 | Tragic 19.7% |
| Guyanese | 0.4 /100 | #247 | Tragic 19.7% |
| Marshallese | 0.4 /100 | #248 | Tragic 19.7% |
| Immigrants | Middle Africa | 0.4 /100 | #249 | Tragic 19.7% |
| Immigrants | Nonimmigrants | 0.4 /100 | #250 | Tragic 19.7% |
| Pennsylvania Germans | 0.3 /100 | #251 | Tragic 19.8% |
| Immigrants | Nicaragua | 0.3 /100 | #252 | Tragic 19.8% |
| Mexican American Indians | 0.3 /100 | #253 | Tragic 19.9% |
| Fijians | 0.3 /100 | #254 | Tragic 19.9% |
| Immigrants | Cuba | 0.2 /100 | #255 | Tragic 19.9% |
| Immigrants | Barbados | 0.2 /100 | #256 | Tragic 20.0% |