Puget Sound Salish vs Immigrants from Middle Africa Family Poverty
COMPARE
Puget Sound Salish
Immigrants from Middle Africa
Family Poverty
Family Poverty Comparison
Puget Sound Salish
Immigrants from Middle Africa
8.4%
FAMILY POVERTY
88.6/ 100
METRIC RATING
131st/ 347
METRIC RANK
10.1%
FAMILY POVERTY
2.1/ 100
METRIC RATING
234th/ 347
METRIC RANK
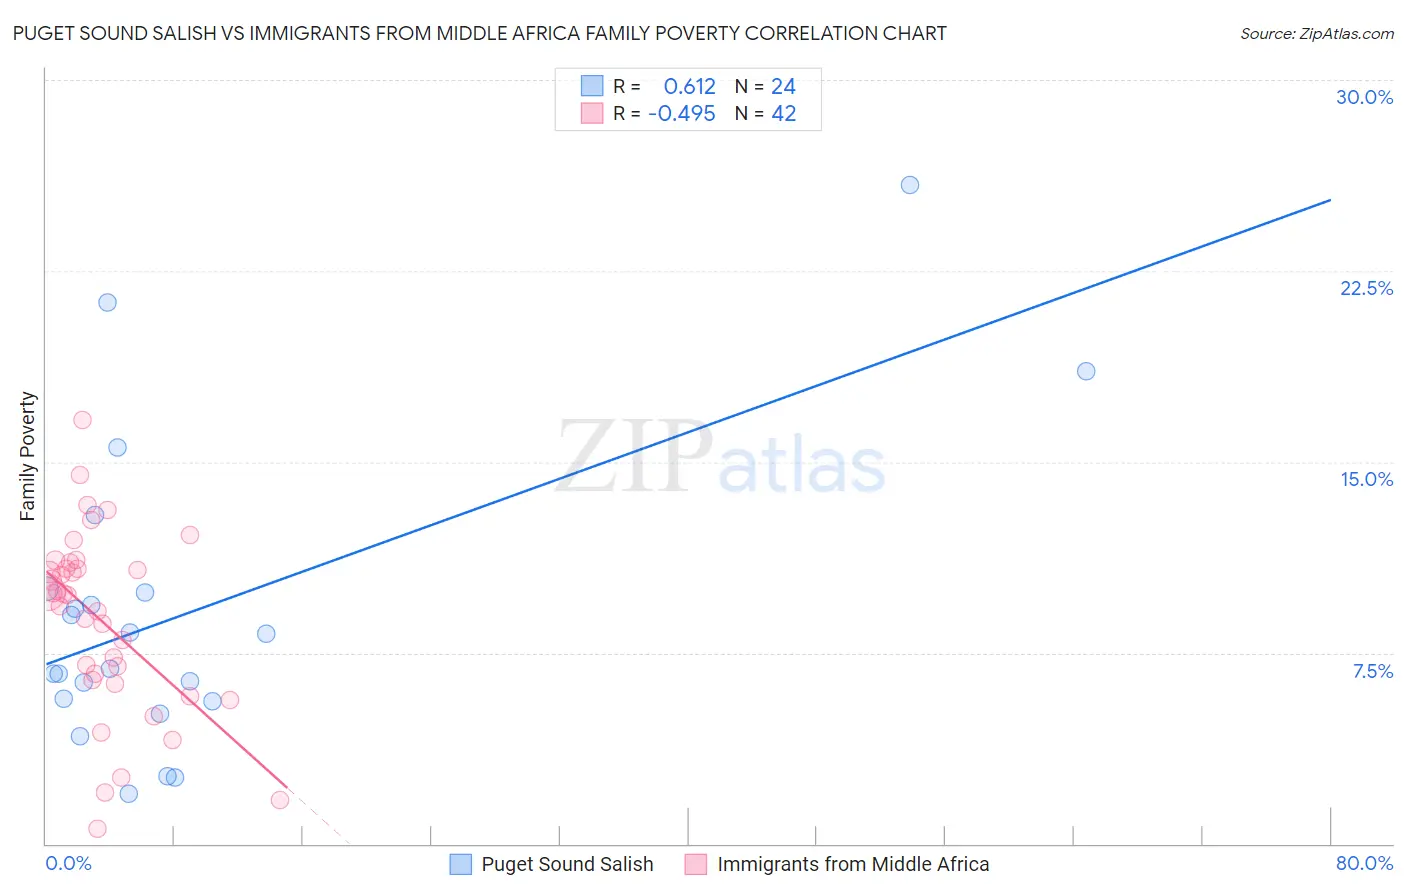
Puget Sound Salish vs Immigrants from Middle Africa Family Poverty Correlation Chart
The statistical analysis conducted on geographies consisting of 46,127,030 people shows a significant positive correlation between the proportion of Puget Sound Salish and poverty level among families in the United States with a correlation coefficient (R) of 0.612 and weighted average of 8.4%. Similarly, the statistical analysis conducted on geographies consisting of 202,471,628 people shows a moderate negative correlation between the proportion of Immigrants from Middle Africa and poverty level among families in the United States with a correlation coefficient (R) of -0.495 and weighted average of 10.1%, a difference of 20.7%.
Family Poverty Correlation Summary
| Measurement | Puget Sound Salish | Immigrants from Middle Africa |
| Minimum | 2.0% | 0.57% |
| Maximum | 25.9% | 16.7% |
| Range | 23.9% | 16.1% |
| Mean | 9.1% | 8.8% |
| Median | 7.6% | 9.8% |
| Interquartile 25% (IQ1) | 5.7% | 6.4% |
| Interquartile 75% (IQ3) | 9.9% | 10.8% |
| Interquartile Range (IQR) | 4.3% | 4.4% |
| Standard Deviation (Sample) | 5.9% | 3.6% |
| Standard Deviation (Population) | 5.8% | 3.5% |
Similar Demographics by Family Poverty
Demographics Similar to Puget Sound Salish by Family Poverty
In terms of family poverty, the demographic groups most similar to Puget Sound Salish are Immigrants from Bosnia and Herzegovina (8.4%, a difference of 0.010%), Immigrants from Argentina (8.4%, a difference of 0.15%), Portuguese (8.4%, a difference of 0.19%), Argentinean (8.4%, a difference of 0.35%), and Immigrants from Hungary (8.4%, a difference of 0.49%).
| Demographics | Rating | Rank | Family Poverty |
| Soviet Union | 90.8 /100 | #124 | Exceptional 8.3% |
| Pakistanis | 90.8 /100 | #125 | Exceptional 8.3% |
| Icelanders | 90.3 /100 | #126 | Exceptional 8.3% |
| Immigrants | Hungary | 89.9 /100 | #127 | Excellent 8.4% |
| Argentineans | 89.6 /100 | #128 | Excellent 8.4% |
| Portuguese | 89.2 /100 | #129 | Excellent 8.4% |
| Immigrants | Bosnia and Herzegovina | 88.6 /100 | #130 | Excellent 8.4% |
| Puget Sound Salish | 88.6 /100 | #131 | Excellent 8.4% |
| Immigrants | Argentina | 88.2 /100 | #132 | Excellent 8.4% |
| Sri Lankans | 86.6 /100 | #133 | Excellent 8.5% |
| Chileans | 86.6 /100 | #134 | Excellent 8.5% |
| Immigrants | Malaysia | 86.5 /100 | #135 | Excellent 8.5% |
| Immigrants | Brazil | 86.3 /100 | #136 | Excellent 8.5% |
| Immigrants | Southern Europe | 86.0 /100 | #137 | Excellent 8.5% |
| Armenians | 84.6 /100 | #138 | Excellent 8.5% |
Demographics Similar to Immigrants from Middle Africa by Family Poverty
In terms of family poverty, the demographic groups most similar to Immigrants from Middle Africa are Nigerian (10.1%, a difference of 0.030%), Fijian (10.1%, a difference of 0.11%), Immigrants from Nigeria (10.2%, a difference of 0.28%), Immigrants from Sudan (10.1%, a difference of 0.36%), and Immigrants from Laos (10.2%, a difference of 0.54%).
| Demographics | Rating | Rank | Family Poverty |
| Immigrants | Armenia | 3.3 /100 | #227 | Tragic 10.0% |
| Sudanese | 3.1 /100 | #228 | Tragic 10.0% |
| Immigrants | Uzbekistan | 3.1 /100 | #229 | Tragic 10.0% |
| Immigrants | Panama | 3.1 /100 | #230 | Tragic 10.0% |
| Alaskan Athabascans | 2.7 /100 | #231 | Tragic 10.1% |
| Immigrants | Sudan | 2.3 /100 | #232 | Tragic 10.1% |
| Fijians | 2.1 /100 | #233 | Tragic 10.1% |
| Immigrants | Middle Africa | 2.1 /100 | #234 | Tragic 10.1% |
| Nigerians | 2.0 /100 | #235 | Tragic 10.1% |
| Immigrants | Nigeria | 1.9 /100 | #236 | Tragic 10.2% |
| Immigrants | Laos | 1.7 /100 | #237 | Tragic 10.2% |
| French American Indians | 1.5 /100 | #238 | Tragic 10.2% |
| Potawatomi | 1.5 /100 | #239 | Tragic 10.2% |
| Immigrants | Azores | 1.4 /100 | #240 | Tragic 10.3% |
| Ghanaians | 1.3 /100 | #241 | Tragic 10.3% |