Puget Sound Salish vs Immigrants from Israel Child Poverty Under the Age of 5
COMPARE
Puget Sound Salish
Immigrants from Israel
Child Poverty Under the Age of 5
Child Poverty Under the Age of 5 Comparison
Puget Sound Salish
Immigrants from Israel
16.0%
CHILD POVERTY UNDER THE AGE OF 5
94.1/ 100
METRIC RATING
113th/ 347
METRIC RANK
14.9%
CHILD POVERTY UNDER THE AGE OF 5
99.4/ 100
METRIC RATING
54th/ 347
METRIC RANK
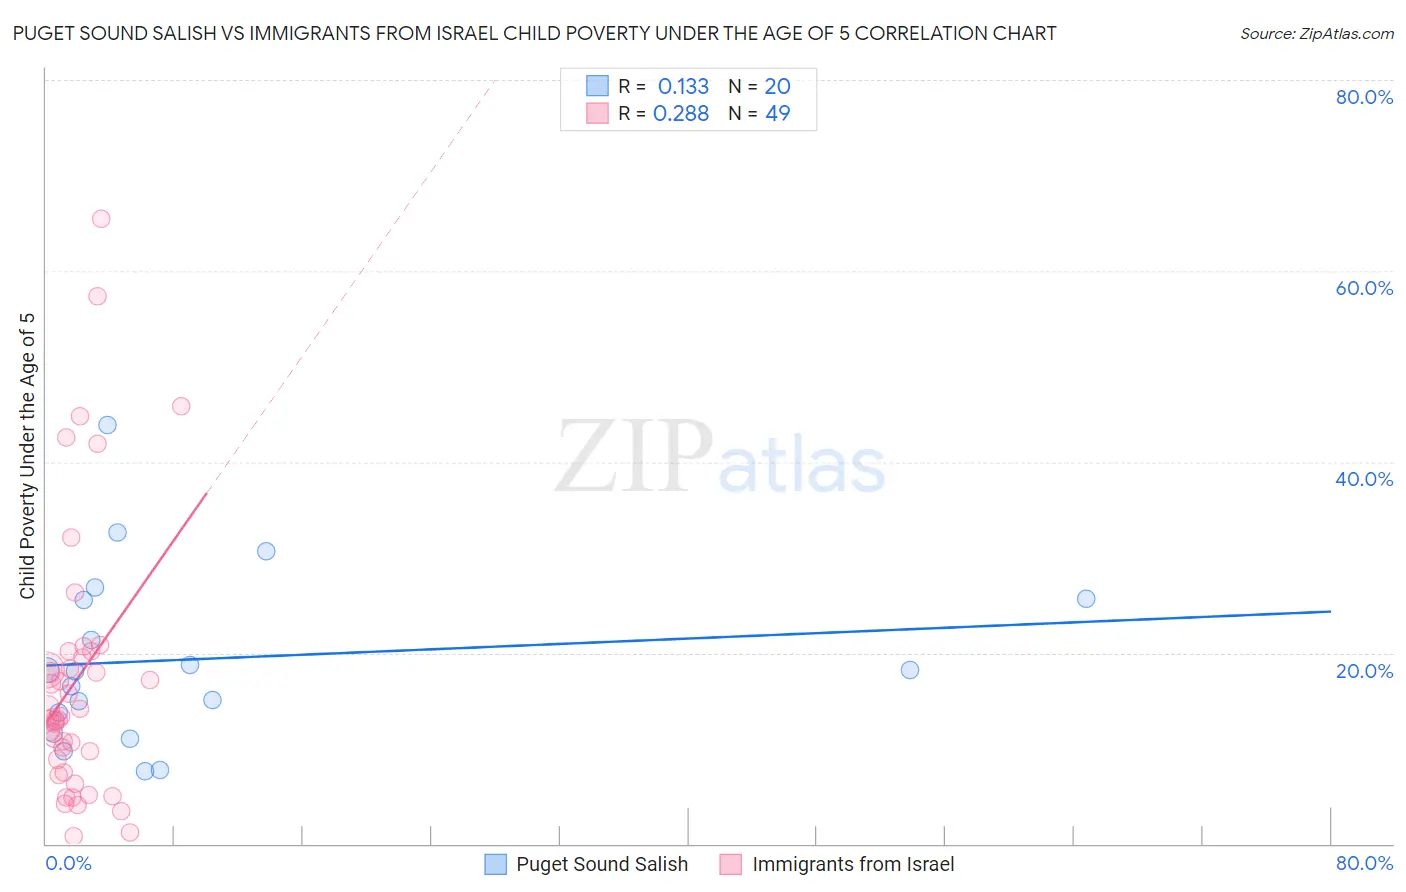
Puget Sound Salish vs Immigrants from Israel Child Poverty Under the Age of 5 Correlation Chart
The statistical analysis conducted on geographies consisting of 45,628,509 people shows a poor positive correlation between the proportion of Puget Sound Salish and poverty level among children under the age of 5 in the United States with a correlation coefficient (R) of 0.133 and weighted average of 16.0%. Similarly, the statistical analysis conducted on geographies consisting of 202,374,512 people shows a weak positive correlation between the proportion of Immigrants from Israel and poverty level among children under the age of 5 in the United States with a correlation coefficient (R) of 0.288 and weighted average of 14.9%, a difference of 7.3%.
Child Poverty Under the Age of 5 Correlation Summary
| Measurement | Puget Sound Salish | Immigrants from Israel |
| Minimum | 7.6% | 0.72% |
| Maximum | 43.9% | 65.4% |
| Range | 36.3% | 64.7% |
| Mean | 19.4% | 17.2% |
| Median | 18.1% | 13.3% |
| Interquartile 25% (IQ1) | 12.7% | 8.1% |
| Interquartile 75% (IQ3) | 25.6% | 19.9% |
| Interquartile Range (IQR) | 12.9% | 11.7% |
| Standard Deviation (Sample) | 9.2% | 14.1% |
| Standard Deviation (Population) | 9.0% | 14.0% |
Similar Demographics by Child Poverty Under the Age of 5
Demographics Similar to Puget Sound Salish by Child Poverty Under the Age of 5
In terms of child poverty under the age of 5, the demographic groups most similar to Puget Sound Salish are Peruvian (16.0%, a difference of 0.010%), Pakistani (16.0%, a difference of 0.060%), Immigrants from Kuwait (16.0%, a difference of 0.090%), Northern European (16.0%, a difference of 0.10%), and Romanian (16.0%, a difference of 0.10%).
| Demographics | Rating | Rank | Child Poverty Under the Age of 5 |
| Tlingit-Haida | 94.7 /100 | #106 | Exceptional 15.9% |
| Slovenes | 94.4 /100 | #107 | Exceptional 16.0% |
| Immigrants | Brazil | 94.4 /100 | #108 | Exceptional 16.0% |
| Northern Europeans | 94.3 /100 | #109 | Exceptional 16.0% |
| Romanians | 94.3 /100 | #110 | Exceptional 16.0% |
| Pakistanis | 94.2 /100 | #111 | Exceptional 16.0% |
| Peruvians | 94.1 /100 | #112 | Exceptional 16.0% |
| Puget Sound Salish | 94.1 /100 | #113 | Exceptional 16.0% |
| Immigrants | Kuwait | 93.9 /100 | #114 | Exceptional 16.0% |
| Albanians | 93.8 /100 | #115 | Exceptional 16.0% |
| Immigrants | Austria | 93.5 /100 | #116 | Exceptional 16.0% |
| Basques | 93.4 /100 | #117 | Exceptional 16.0% |
| Immigrants | Denmark | 93.4 /100 | #118 | Exceptional 16.0% |
| Immigrants | Jordan | 93.2 /100 | #119 | Exceptional 16.1% |
| Immigrants | Peru | 92.6 /100 | #120 | Exceptional 16.1% |
Demographics Similar to Immigrants from Israel by Child Poverty Under the Age of 5
In terms of child poverty under the age of 5, the demographic groups most similar to Immigrants from Israel are Luxembourger (14.9%, a difference of 0.0%), Danish (14.9%, a difference of 0.060%), Immigrants from Pakistan (14.9%, a difference of 0.13%), Immigrants from Serbia (14.9%, a difference of 0.17%), and Egyptian (14.9%, a difference of 0.21%).
| Demographics | Rating | Rank | Child Poverty Under the Age of 5 |
| Russians | 99.6 /100 | #47 | Exceptional 14.8% |
| Immigrants | Czechoslovakia | 99.6 /100 | #48 | Exceptional 14.8% |
| Immigrants | Bulgaria | 99.6 /100 | #49 | Exceptional 14.8% |
| Immigrants | Northern Europe | 99.6 /100 | #50 | Exceptional 14.8% |
| Estonians | 99.6 /100 | #51 | Exceptional 14.8% |
| Immigrants | Serbia | 99.5 /100 | #52 | Exceptional 14.9% |
| Luxembourgers | 99.4 /100 | #53 | Exceptional 14.9% |
| Immigrants | Israel | 99.4 /100 | #54 | Exceptional 14.9% |
| Danes | 99.4 /100 | #55 | Exceptional 14.9% |
| Immigrants | Pakistan | 99.4 /100 | #56 | Exceptional 14.9% |
| Egyptians | 99.4 /100 | #57 | Exceptional 14.9% |
| Swedes | 99.4 /100 | #58 | Exceptional 15.0% |
| Paraguayans | 99.4 /100 | #59 | Exceptional 15.0% |
| Immigrants | Russia | 99.3 /100 | #60 | Exceptional 15.0% |
| Immigrants | Poland | 99.1 /100 | #61 | Exceptional 15.1% |