Puget Sound Salish vs Immigrants from Uruguay Child Poverty Under the Age of 5
COMPARE
Puget Sound Salish
Immigrants from Uruguay
Child Poverty Under the Age of 5
Child Poverty Under the Age of 5 Comparison
Puget Sound Salish
Immigrants from Uruguay
16.0%
CHILD POVERTY UNDER THE AGE OF 5
94.1/ 100
METRIC RATING
113th/ 347
METRIC RANK
17.7%
CHILD POVERTY UNDER THE AGE OF 5
27.8/ 100
METRIC RATING
192nd/ 347
METRIC RANK
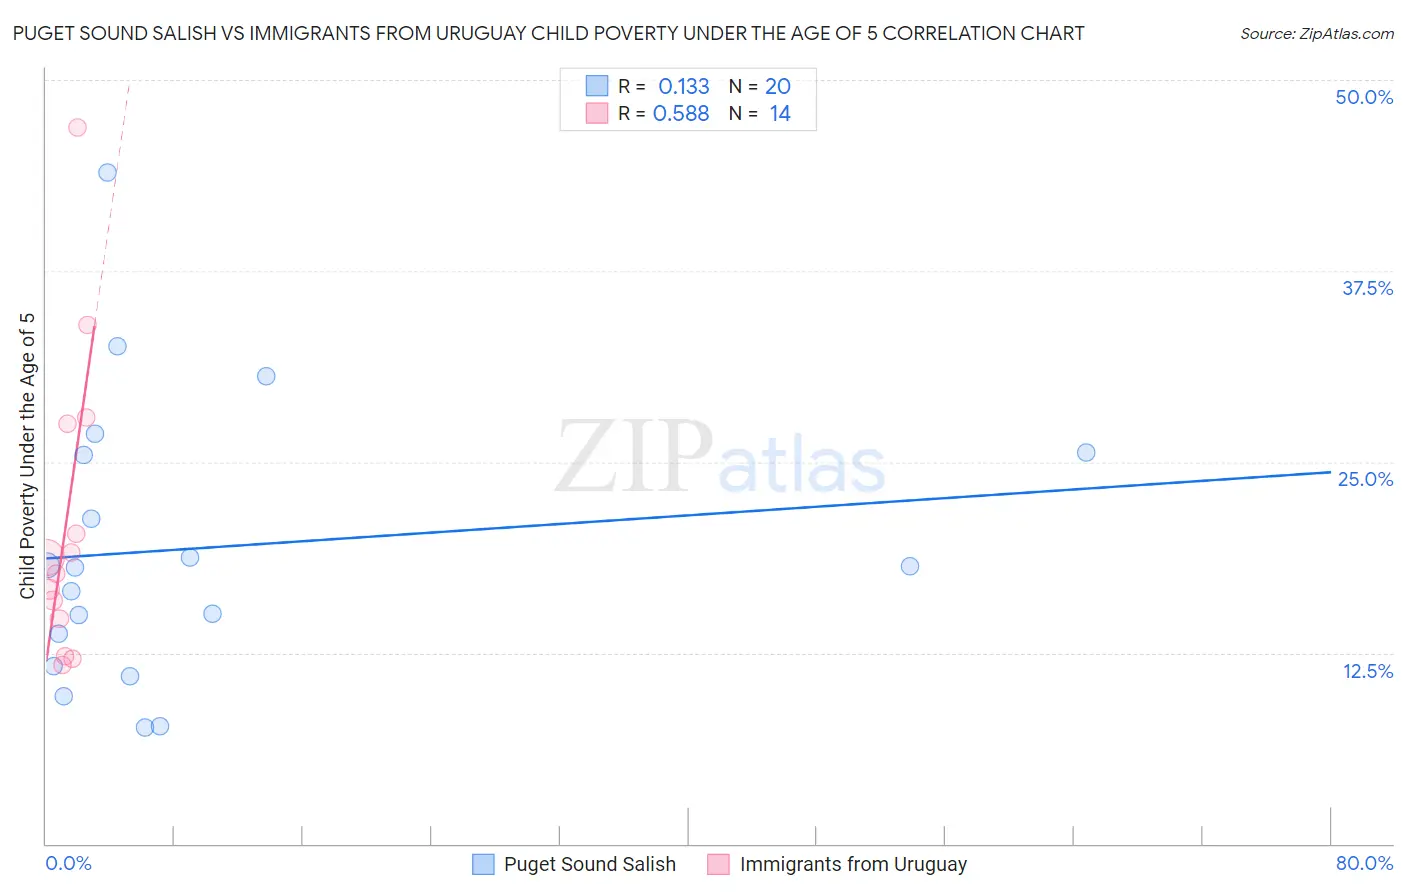
Puget Sound Salish vs Immigrants from Uruguay Child Poverty Under the Age of 5 Correlation Chart
The statistical analysis conducted on geographies consisting of 45,628,509 people shows a poor positive correlation between the proportion of Puget Sound Salish and poverty level among children under the age of 5 in the United States with a correlation coefficient (R) of 0.133 and weighted average of 16.0%. Similarly, the statistical analysis conducted on geographies consisting of 130,958,441 people shows a substantial positive correlation between the proportion of Immigrants from Uruguay and poverty level among children under the age of 5 in the United States with a correlation coefficient (R) of 0.588 and weighted average of 17.7%, a difference of 10.4%.
Child Poverty Under the Age of 5 Correlation Summary
| Measurement | Puget Sound Salish | Immigrants from Uruguay |
| Minimum | 7.6% | 11.7% |
| Maximum | 43.9% | 46.9% |
| Range | 36.3% | 35.2% |
| Mean | 19.4% | 21.1% |
| Median | 18.1% | 18.2% |
| Interquartile 25% (IQ1) | 12.7% | 14.7% |
| Interquartile 75% (IQ3) | 25.6% | 27.5% |
| Interquartile Range (IQR) | 12.9% | 12.8% |
| Standard Deviation (Sample) | 9.2% | 9.9% |
| Standard Deviation (Population) | 9.0% | 9.5% |
Similar Demographics by Child Poverty Under the Age of 5
Demographics Similar to Puget Sound Salish by Child Poverty Under the Age of 5
In terms of child poverty under the age of 5, the demographic groups most similar to Puget Sound Salish are Peruvian (16.0%, a difference of 0.010%), Pakistani (16.0%, a difference of 0.060%), Immigrants from Kuwait (16.0%, a difference of 0.090%), Northern European (16.0%, a difference of 0.10%), and Romanian (16.0%, a difference of 0.10%).
| Demographics | Rating | Rank | Child Poverty Under the Age of 5 |
| Tlingit-Haida | 94.7 /100 | #106 | Exceptional 15.9% |
| Slovenes | 94.4 /100 | #107 | Exceptional 16.0% |
| Immigrants | Brazil | 94.4 /100 | #108 | Exceptional 16.0% |
| Northern Europeans | 94.3 /100 | #109 | Exceptional 16.0% |
| Romanians | 94.3 /100 | #110 | Exceptional 16.0% |
| Pakistanis | 94.2 /100 | #111 | Exceptional 16.0% |
| Peruvians | 94.1 /100 | #112 | Exceptional 16.0% |
| Puget Sound Salish | 94.1 /100 | #113 | Exceptional 16.0% |
| Immigrants | Kuwait | 93.9 /100 | #114 | Exceptional 16.0% |
| Albanians | 93.8 /100 | #115 | Exceptional 16.0% |
| Immigrants | Austria | 93.5 /100 | #116 | Exceptional 16.0% |
| Basques | 93.4 /100 | #117 | Exceptional 16.0% |
| Immigrants | Denmark | 93.4 /100 | #118 | Exceptional 16.0% |
| Immigrants | Jordan | 93.2 /100 | #119 | Exceptional 16.1% |
| Immigrants | Peru | 92.6 /100 | #120 | Exceptional 16.1% |
Demographics Similar to Immigrants from Uruguay by Child Poverty Under the Age of 5
In terms of child poverty under the age of 5, the demographic groups most similar to Immigrants from Uruguay are Immigrants from Afghanistan (17.7%, a difference of 0.0%), Slovak (17.6%, a difference of 0.17%), Immigrants from Uganda (17.7%, a difference of 0.37%), French Canadian (17.7%, a difference of 0.43%), and Sierra Leonean (17.7%, a difference of 0.49%).
| Demographics | Rating | Rank | Child Poverty Under the Age of 5 |
| Immigrants | Armenia | 38.0 /100 | #185 | Fair 17.5% |
| Immigrants | Bosnia and Herzegovina | 35.0 /100 | #186 | Fair 17.5% |
| Kenyans | 34.7 /100 | #187 | Fair 17.5% |
| Carpatho Rusyns | 33.6 /100 | #188 | Fair 17.5% |
| French | 33.6 /100 | #189 | Fair 17.5% |
| Slovaks | 29.2 /100 | #190 | Fair 17.6% |
| Immigrants | Afghanistan | 27.9 /100 | #191 | Fair 17.7% |
| Immigrants | Uruguay | 27.8 /100 | #192 | Fair 17.7% |
| Immigrants | Uganda | 25.0 /100 | #193 | Fair 17.7% |
| French Canadians | 24.6 /100 | #194 | Fair 17.7% |
| Sierra Leoneans | 24.1 /100 | #195 | Fair 17.7% |
| Immigrants | Portugal | 22.2 /100 | #196 | Fair 17.8% |
| Immigrants | Kenya | 20.0 /100 | #197 | Fair 17.9% |
| Celtics | 18.3 /100 | #198 | Poor 17.9% |
| Hungarians | 18.3 /100 | #199 | Poor 17.9% |