Puget Sound Salish vs Immigrants from Jamaica Child Poverty Under the Age of 5

COMPARE

Puget Sound Salish
Race
Ancestry
AfghanAfricanAlaska NativeAlaskan AthabascanAlbanianAleutAlsatianAmericanApacheArabArapahoArgentineanArmenianAssyrian/Chaldean/SyriacAustralianAustrianBahamianBangladeshiBarbadianBasqueBelgianBelizeanBermudanBhutaneseBlackfeetBolivianBrazilianBritishBritish West IndianBulgarianBurmeseCajunCambodianCanadianCape VerdeanCarpatho RusynCelticCentral AmericanCentral American IndianCherokeeCheyenneChickasawChileanChineseChippewaChoctawColombianColvilleComancheCosta RicanCreeCreekCroatianCrowCubanCypriotCzechCzechoslovakianDanishDelawareDominicanDutchDutch West IndianEastern EuropeanEcuadorianEgyptianEnglishEstonianEthiopianEuropeanFijianFilipinoFinnishFrenchFrench American IndianFrench CanadianGermanGerman RussianGhanaianGreekGuamanian/ChamorroGuatemalanGuyaneseHaitianHmongHonduranHopiHoumaHungarianIcelanderIndian (Asian)IndonesianInupiatIranianIraqiIrishIroquoisIsraeliItalianJamaicanJapaneseJordanianKenyanKiowaKoreanLaotianLatvianLebaneseLiberianLithuanianLumbeeLuxembourgerMacedonianMalaysianMalteseMarshalleseMenomineeMexicanMexican American IndianMongolianMoroccanNative HawaiianNavajoNepaleseNew ZealanderNicaraguanNigerianNorthern EuropeanNorwegianOkinawanOsageOttawaPaiutePakistaniPalestinianPanamanianParaguayanPennsylvania GermanPeruvianPimaPolishPortuguesePotawatomiPuebloPuerto RicanPuget Sound SalishRomanianRussianSalvadoranSamoanScandinavianScotch-IrishScottishSeminoleSenegaleseSerbianShoshoneSierra LeoneanSiouxSlavicSlovakSloveneSomaliSouth AfricanSouth AmericanSouth American IndianSoviet UnionSpaniardSpanishSpanish AmericanSpanish American IndianSri LankanSubsaharan AfricanSudaneseSwedishSwissSyrianTaiwaneseThaiTlingit-HaidaTohono O'OdhamTonganTrinidadian and TobagonianTsimshianTurkishU.S. Virgin IslanderUgandanUkrainianUruguayanUteVenezuelanVietnameseWelshWest IndianYakamaYaquiYugoslavianYumanYup'ikZimbabwean
Immigration
NonimmigrantsImmigrantsAfghanistanAfricaAlbaniaArgentinaArmeniaAsiaAustraliaAustriaBahamasBangladeshBarbadosBelarusBelgiumBelizeBoliviaBosnia and HerzegovinaBrazilBulgariaBurma/MyanmarCabo VerdeCambodiaCameroonCanadaCaribbeanCentral AmericaChileChinaColombiaCongoCosta RicaCroatiaCubaCzechoslovakiaDenmarkDominicaDominican RepublicEastern AfricaEastern AsiaEastern EuropeEcuadorEgyptEl SalvadorEnglandEritreaEthiopiaEuropeFijiFranceGermanyGhanaGreeceGrenadaGuatemalaGuyanaHaitiHondurasHong KongHungaryIndiaIndonesiaIranIraqIrelandIsraelItalyJapanJordanKazakhstanKenyaKoreaKuwaitLaosLatin AmericaLatviaLebanonLiberiaLithuaniaMalaysiaMexicoMicronesiaMiddle AfricaMoldovaMoroccoNepalNetherlandsNicaraguaNigeriaNorth AmericaNorth MacedoniaNorthern AfricaNorthern EuropeNorwayOceaniaPakistanPanamaPeruPhilippinesPolandPortugalRomaniaRussiaSaudi ArabiaScotlandSenegalSerbiaSierra LeoneSingaporeSomaliaSouth AfricaSouth AmericaSouth Central AsiaSouth Eastern AsiaSouthern EuropeSpainSri LankaSt. Vincent and the GrenadinesSudanSwedenSwitzerlandSyriaTaiwanThailandTrinidad and TobagoTurkeyUgandaUkraineUruguayUzbekistanVenezuelaVietnamWest IndiesWestern AfricaWestern AsiaWestern EuropeYemenZaireZimbabweAzores
Immigrants from Jamaica
Race
Ancestry
AfghanAfricanAlaska NativeAlaskan AthabascanAlbanianAleutAlsatianAmericanApacheArabArapahoArgentineanArmenianAssyrian/Chaldean/SyriacAustralianAustrianBahamianBangladeshiBarbadianBasqueBelgianBelizeanBermudanBhutaneseBlackfeetBolivianBrazilianBritishBritish West IndianBulgarianBurmeseCajunCambodianCanadianCape VerdeanCarpatho RusynCelticCentral AmericanCentral American IndianCherokeeCheyenneChickasawChileanChineseChippewaChoctawColombianColvilleComancheCosta RicanCreeCreekCroatianCrowCubanCypriotCzechCzechoslovakianDanishDelawareDominicanDutchDutch West IndianEastern EuropeanEcuadorianEgyptianEnglishEstonianEthiopianEuropeanFijianFilipinoFinnishFrenchFrench American IndianFrench CanadianGermanGerman RussianGhanaianGreekGuamanian/ChamorroGuatemalanGuyaneseHaitianHmongHonduranHopiHoumaHungarianIcelanderIndian (Asian)IndonesianInupiatIranianIraqiIrishIroquoisIsraeliItalianJamaicanJapaneseJordanianKenyanKiowaKoreanLaotianLatvianLebaneseLiberianLithuanianLumbeeLuxembourgerMacedonianMalaysianMalteseMarshalleseMenomineeMexicanMexican American IndianMongolianMoroccanNative HawaiianNavajoNepaleseNew ZealanderNicaraguanNigerianNorthern EuropeanNorwegianOkinawanOsageOttawaPaiutePakistaniPalestinianPanamanianParaguayanPennsylvania GermanPeruvianPimaPolishPortuguesePotawatomiPuebloPuerto RicanRomanianRussianSalvadoranSamoanScandinavianScotch-IrishScottishSeminoleSenegaleseSerbianShoshoneSierra LeoneanSiouxSlavicSlovakSloveneSomaliSouth AfricanSouth AmericanSouth American IndianSoviet UnionSpaniardSpanishSpanish AmericanSpanish American IndianSri LankanSubsaharan AfricanSudaneseSwedishSwissSyrianTaiwaneseThaiTlingit-HaidaTohono O'OdhamTonganTrinidadian and TobagonianTsimshianTurkishU.S. Virgin IslanderUgandanUkrainianUruguayanUteVenezuelanVietnameseWelshWest IndianYakamaYaquiYugoslavianYumanYup'ikZimbabwean
Immigration
NonimmigrantsImmigrantsAfghanistanAfricaAlbaniaArgentinaArmeniaAsiaAustraliaAustriaBahamasBangladeshBarbadosBelarusBelgiumBelizeBoliviaBosnia and HerzegovinaBrazilBulgariaBurma/MyanmarCabo VerdeCambodiaCameroonCanadaCaribbeanCentral AmericaChileChinaColombiaCongoCosta RicaCroatiaCubaCzechoslovakiaDenmarkDominicaDominican RepublicEastern AfricaEastern AsiaEastern EuropeEcuadorEgyptEl SalvadorEnglandEritreaEthiopiaEuropeFijiFranceGermanyGhanaGreeceGrenadaGuatemalaGuyanaHaitiHondurasHong KongHungaryIndiaIndonesiaIranIraqIrelandIsraelItalyJamaicaJapanJordanKazakhstanKenyaKoreaKuwaitLaosLatin AmericaLatviaLebanonLiberiaLithuaniaMalaysiaMexicoMicronesiaMiddle AfricaMoldovaMoroccoNepalNetherlandsNicaraguaNigeriaNorth AmericaNorth MacedoniaNorthern AfricaNorthern EuropeNorwayOceaniaPakistanPanamaPeruPhilippinesPolandPortugalRomaniaRussiaSaudi ArabiaScotlandSenegalSerbiaSierra LeoneSingaporeSomaliaSouth AfricaSouth AmericaSouth Central AsiaSouth Eastern AsiaSouthern EuropeSpainSri LankaSt. Vincent and the GrenadinesSudanSwedenSwitzerlandSyriaTaiwanThailandTrinidad and TobagoTurkeyUgandaUkraineUruguayUzbekistanVenezuelaVietnamWest IndiesWestern AfricaWestern AsiaWestern EuropeYemenZaireZimbabweAzores
Child Poverty Under the Age of 5
Income
Poverty
Unemployment
Labor Participation
Family Structure
Vehicle Availability
Education Level
Disability

Child Poverty Under the Age of 5 Comparison

Puget Sound Salish

Immigrants from Jamaica

Exceptional
Tragic
16.0%
CHILD POVERTY UNDER THE AGE OF 5
94.1/ 100
METRIC RATING
113th/ 347
METRIC RANK
20.5%
CHILD POVERTY UNDER THE AGE OF 5
0.1/ 100
METRIC RATING
272nd/ 347
METRIC RANK

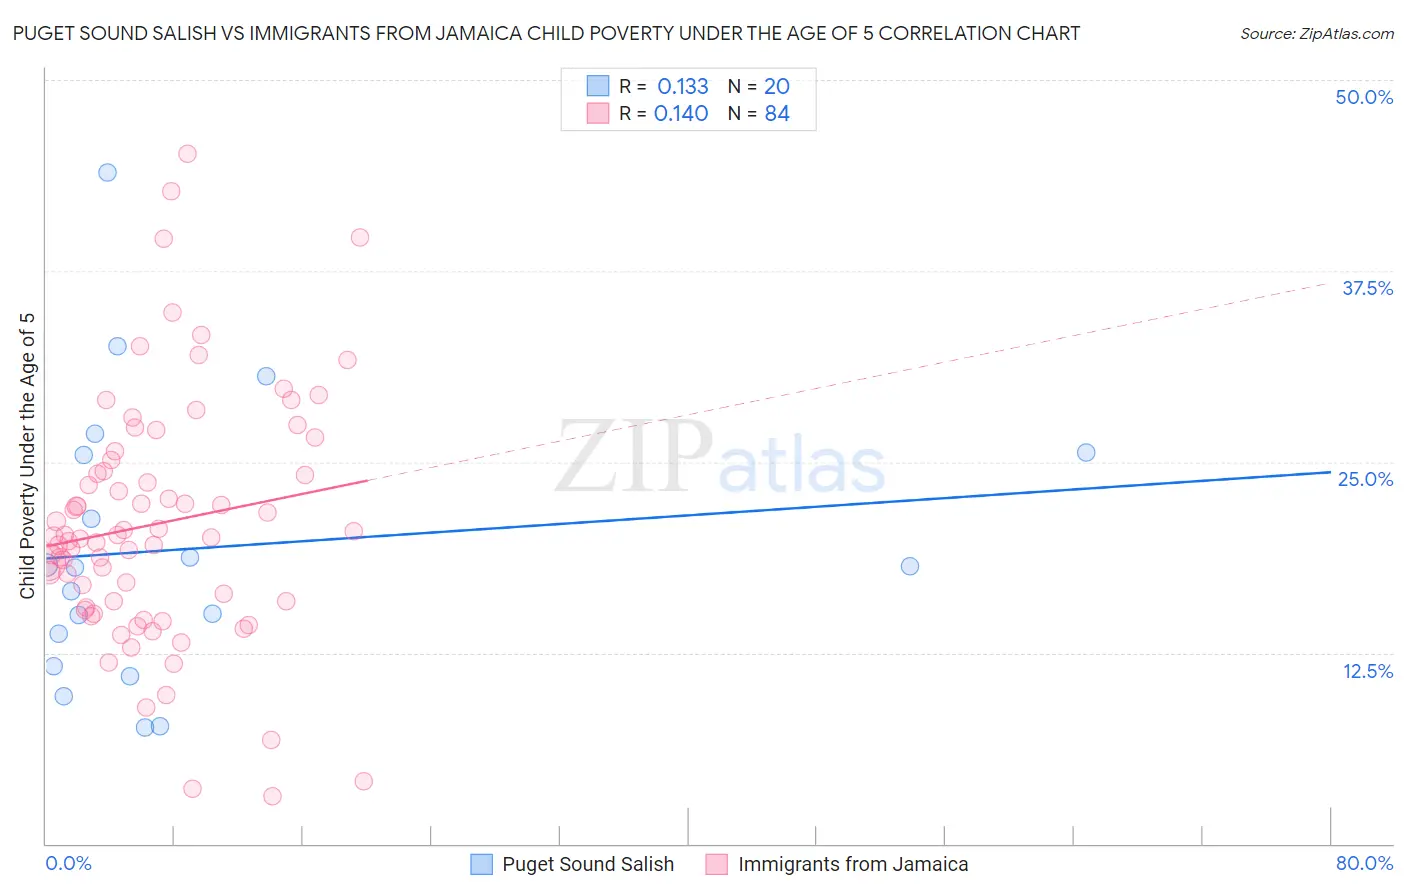
Puget Sound Salish vs Immigrants from Jamaica Child Poverty Under the Age of 5 Correlation Chart

The statistical analysis conducted on geographies consisting of 45,628,509 people shows a poor positive correlation between the proportion of Puget Sound Salish and poverty level among children under the age of 5 in the United States with a correlation coefficient (R) of 0.133 and weighted average of 16.0%. Similarly, the statistical analysis conducted on geographies consisting of 292,663,090 people shows a poor positive correlation between the proportion of Immigrants from Jamaica and poverty level among children under the age of 5 in the United States with a correlation coefficient (R) of 0.140 and weighted average of 20.5%, a difference of 28.1%.
Puget Sound Salish vs Immigrants from Jamaica Child Poverty Under the Age of 5

Child Poverty Under the Age of 5 Correlation Summary

MeasurementPuget Sound SalishImmigrants from Jamaica
Minimum7.6%3.1%
Maximum43.9%45.2%
Range36.3%42.1%
Mean19.4%21.0%
Median18.1%20.1%
Interquartile 25% (IQ1)12.7%15.7%
Interquartile 75% (IQ3)25.6%24.8%
Interquartile Range (IQR)12.9%9.1%
Standard Deviation (Sample)9.2%8.1%
Standard Deviation (Population)9.0%8.0%

Similar Demographics by Child Poverty Under the Age of 5

Demographics Similar to Puget Sound Salish by Child Poverty Under the Age of 5

In terms of child poverty under the age of 5, the demographic groups most similar to Puget Sound Salish are Peruvian (16.0%, a difference of 0.010%), Pakistani (16.0%, a difference of 0.060%), Immigrants from Kuwait (16.0%, a difference of 0.090%), Northern European (16.0%, a difference of 0.10%), and Romanian (16.0%, a difference of 0.10%).
DemographicsRating | RankChild Poverty Under the Age of 5
Tlingit-Haida
94.7
/100
|
#106
Exceptional
15.9%
Slovenes
94.4
/100
|
#107
Exceptional
16.0%
Immigrants | Brazil
94.4
/100
|
#108
Exceptional
16.0%
Northern Europeans
94.3
/100
|
#109
Exceptional
16.0%
Romanians
94.3
/100
|
#110
Exceptional
16.0%
Pakistanis
94.2
/100
|
#111
Exceptional
16.0%
Peruvians
94.1
/100
|
#112
Exceptional
16.0%
Puget Sound Salish
94.1
/100
|
#113
Exceptional
16.0%
Immigrants | Kuwait
93.9
/100
|
#114
Exceptional
16.0%
Albanians
93.8
/100
|
#115
Exceptional
16.0%
Immigrants | Austria
93.5
/100
|
#116
Exceptional
16.0%
Basques
93.4
/100
|
#117
Exceptional
16.0%
Immigrants | Denmark
93.4
/100
|
#118
Exceptional
16.0%
Immigrants | Jordan
93.2
/100
|
#119
Exceptional
16.1%
Immigrants | Peru
92.6
/100
|
#120
Exceptional
16.1%

Demographics Similar to Immigrants from Jamaica by Child Poverty Under the Age of 5

In terms of child poverty under the age of 5, the demographic groups most similar to Immigrants from Jamaica are American (20.5%, a difference of 0.12%), Central American (20.6%, a difference of 0.52%), Jamaican (20.4%, a difference of 0.57%), Immigrants from Belize (20.6%, a difference of 0.62%), and Immigrants from Burma/Myanmar (20.4%, a difference of 0.65%).
DemographicsRating | RankChild Poverty Under the Age of 5
Spanish American Indians
0.1
/100
|
#265
Tragic
20.2%
Aleuts
0.1
/100
|
#266
Tragic
20.3%
Ottawa
0.1
/100
|
#267
Tragic
20.3%
Belizeans
0.1
/100
|
#268
Tragic
20.3%
Immigrants | Burma/Myanmar
0.1
/100
|
#269
Tragic
20.4%
Jamaicans
0.1
/100
|
#270
Tragic
20.4%
Americans
0.1
/100
|
#271
Tragic
20.5%
Immigrants | Jamaica
0.1
/100
|
#272
Tragic
20.5%
Central Americans
0.1
/100
|
#273
Tragic
20.6%
Immigrants | Belize
0.1
/100
|
#274
Tragic
20.6%
Bangladeshis
0.1
/100
|
#275
Tragic
20.6%
West Indians
0.0
/100
|
#276
Tragic
20.6%
Immigrants | West Indies
0.0
/100
|
#277
Tragic
20.7%
Immigrants | Grenada
0.0
/100
|
#278
Tragic
20.7%
Sub-Saharan Africans
0.0
/100
|
#279
Tragic
20.8%