Puget Sound Salish vs Colville Child Poverty Under the Age of 5
COMPARE
Puget Sound Salish
Colville
Child Poverty Under the Age of 5
Child Poverty Under the Age of 5 Comparison
Puget Sound Salish
Colville
16.0%
CHILD POVERTY UNDER THE AGE OF 5
94.1/ 100
METRIC RATING
113th/ 347
METRIC RANK
25.7%
CHILD POVERTY UNDER THE AGE OF 5
0.0/ 100
METRIC RATING
335th/ 347
METRIC RANK
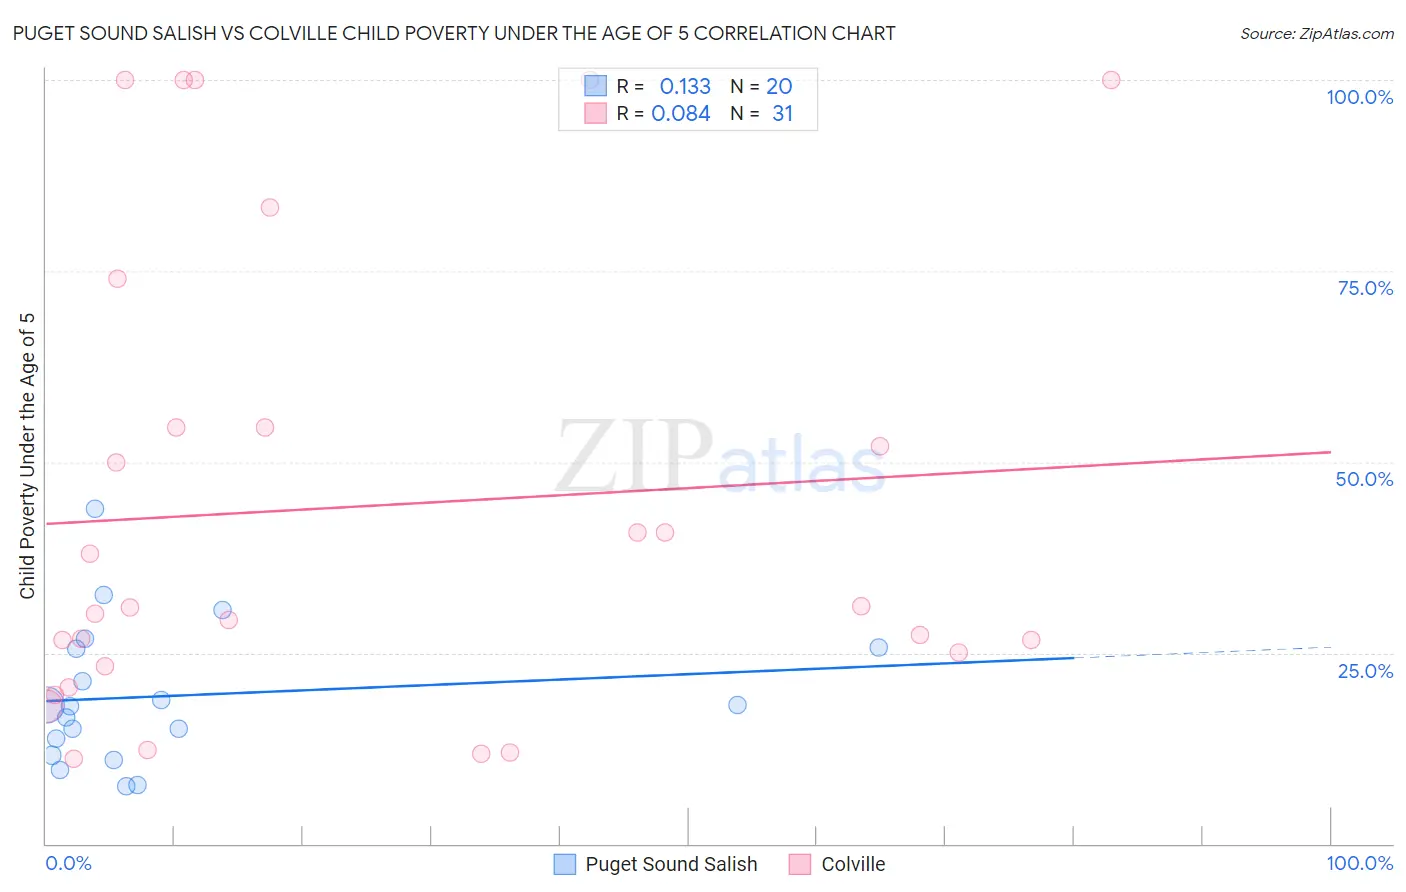
Puget Sound Salish vs Colville Child Poverty Under the Age of 5 Correlation Chart
The statistical analysis conducted on geographies consisting of 45,628,509 people shows a poor positive correlation between the proportion of Puget Sound Salish and poverty level among children under the age of 5 in the United States with a correlation coefficient (R) of 0.133 and weighted average of 16.0%. Similarly, the statistical analysis conducted on geographies consisting of 34,435,205 people shows a slight positive correlation between the proportion of Colville and poverty level among children under the age of 5 in the United States with a correlation coefficient (R) of 0.084 and weighted average of 25.7%, a difference of 60.6%.
Child Poverty Under the Age of 5 Correlation Summary
| Measurement | Puget Sound Salish | Colville |
| Minimum | 7.6% | 11.1% |
| Maximum | 43.9% | 100.0% |
| Range | 36.3% | 88.9% |
| Mean | 19.4% | 44.2% |
| Median | 18.1% | 30.9% |
| Interquartile 25% (IQ1) | 12.7% | 23.2% |
| Interquartile 75% (IQ3) | 25.6% | 54.5% |
| Interquartile Range (IQR) | 12.9% | 31.3% |
| Standard Deviation (Sample) | 9.2% | 30.1% |
| Standard Deviation (Population) | 9.0% | 29.6% |
Similar Demographics by Child Poverty Under the Age of 5
Demographics Similar to Puget Sound Salish by Child Poverty Under the Age of 5
In terms of child poverty under the age of 5, the demographic groups most similar to Puget Sound Salish are Peruvian (16.0%, a difference of 0.010%), Pakistani (16.0%, a difference of 0.060%), Immigrants from Kuwait (16.0%, a difference of 0.090%), Northern European (16.0%, a difference of 0.10%), and Romanian (16.0%, a difference of 0.10%).
| Demographics | Rating | Rank | Child Poverty Under the Age of 5 |
| Tlingit-Haida | 94.7 /100 | #106 | Exceptional 15.9% |
| Slovenes | 94.4 /100 | #107 | Exceptional 16.0% |
| Immigrants | Brazil | 94.4 /100 | #108 | Exceptional 16.0% |
| Northern Europeans | 94.3 /100 | #109 | Exceptional 16.0% |
| Romanians | 94.3 /100 | #110 | Exceptional 16.0% |
| Pakistanis | 94.2 /100 | #111 | Exceptional 16.0% |
| Peruvians | 94.1 /100 | #112 | Exceptional 16.0% |
| Puget Sound Salish | 94.1 /100 | #113 | Exceptional 16.0% |
| Immigrants | Kuwait | 93.9 /100 | #114 | Exceptional 16.0% |
| Albanians | 93.8 /100 | #115 | Exceptional 16.0% |
| Immigrants | Austria | 93.5 /100 | #116 | Exceptional 16.0% |
| Basques | 93.4 /100 | #117 | Exceptional 16.0% |
| Immigrants | Denmark | 93.4 /100 | #118 | Exceptional 16.0% |
| Immigrants | Jordan | 93.2 /100 | #119 | Exceptional 16.1% |
| Immigrants | Peru | 92.6 /100 | #120 | Exceptional 16.1% |
Demographics Similar to Colville by Child Poverty Under the Age of 5
In terms of child poverty under the age of 5, the demographic groups most similar to Colville are Black/African American (25.7%, a difference of 0.0%), Native/Alaskan (25.6%, a difference of 0.50%), Apache (25.0%, a difference of 2.8%), Sioux (26.9%, a difference of 4.9%), and Kiowa (24.5%, a difference of 5.0%).
| Demographics | Rating | Rank | Child Poverty Under the Age of 5 |
| Immigrants | Dominican Republic | 0.0 /100 | #328 | Tragic 24.1% |
| Cajuns | 0.0 /100 | #329 | Tragic 24.1% |
| Creek | 0.0 /100 | #330 | Tragic 24.2% |
| Kiowa | 0.0 /100 | #331 | Tragic 24.5% |
| Apache | 0.0 /100 | #332 | Tragic 25.0% |
| Natives/Alaskans | 0.0 /100 | #333 | Tragic 25.6% |
| Blacks/African Americans | 0.0 /100 | #334 | Tragic 25.7% |
| Colville | 0.0 /100 | #335 | Tragic 25.7% |
| Sioux | 0.0 /100 | #336 | Tragic 26.9% |
| Pima | 0.0 /100 | #337 | Tragic 27.4% |
| Hopi | 0.0 /100 | #338 | Tragic 27.7% |
| Yup'ik | 0.0 /100 | #339 | Tragic 27.7% |
| Cheyenne | 0.0 /100 | #340 | Tragic 28.3% |
| Immigrants | Yemen | 0.0 /100 | #341 | Tragic 29.3% |
| Tohono O'odham | 0.0 /100 | #342 | Tragic 29.5% |