Puget Sound Salish vs Immigrants from Jamaica Unemployment
COMPARE
Puget Sound Salish
Immigrants from Jamaica
Unemployment
Unemployment Comparison
Puget Sound Salish
Immigrants from Jamaica
5.2%
UNEMPLOYMENT
56.6/ 100
METRIC RATING
171st/ 347
METRIC RANK
6.4%
UNEMPLOYMENT
0.0/ 100
METRIC RATING
304th/ 347
METRIC RANK
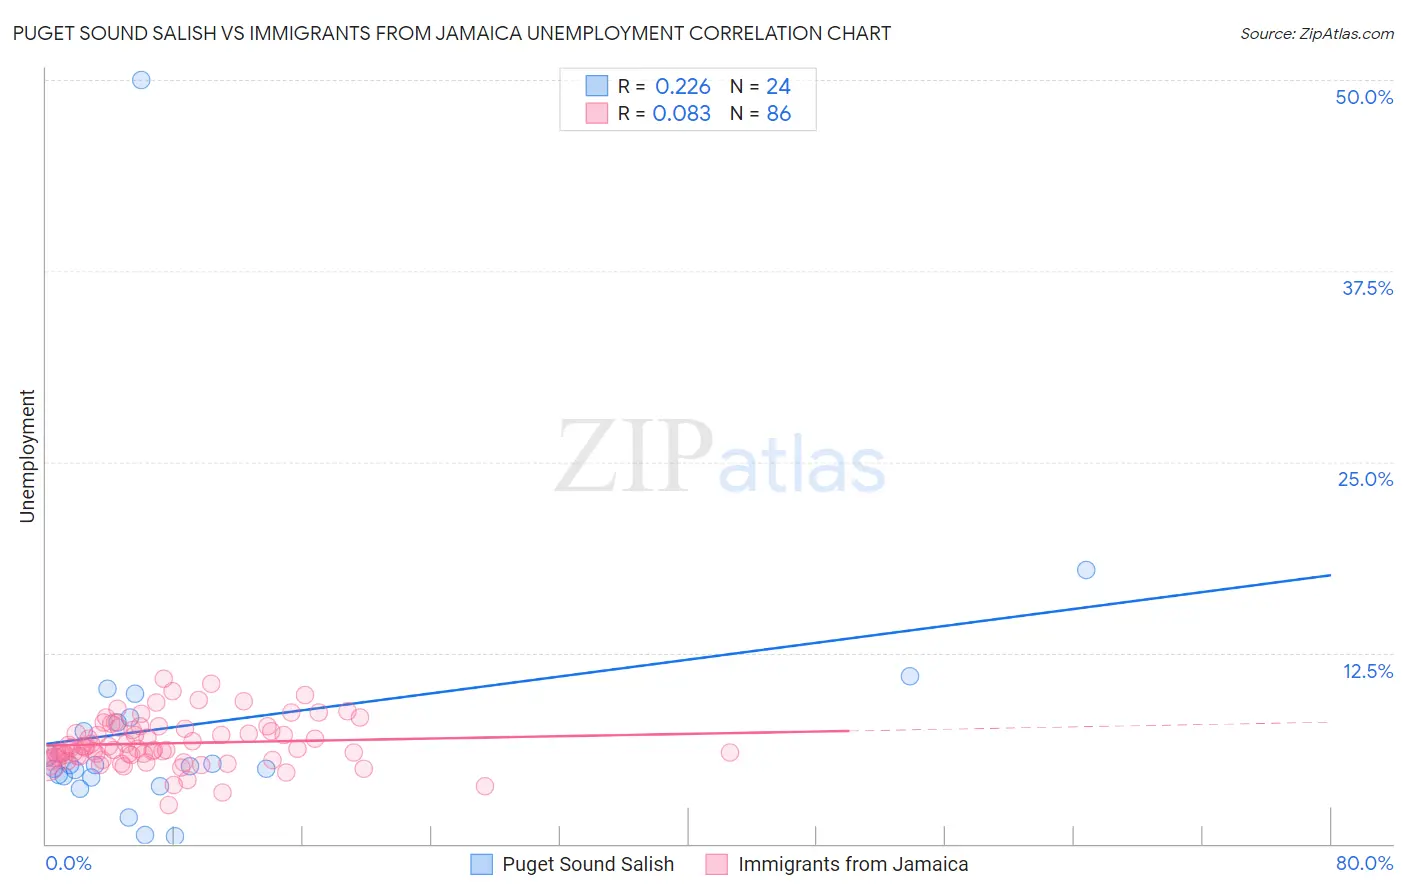
Puget Sound Salish vs Immigrants from Jamaica Unemployment Correlation Chart
The statistical analysis conducted on geographies consisting of 46,125,873 people shows a weak positive correlation between the proportion of Puget Sound Salish and unemployment in the United States with a correlation coefficient (R) of 0.226 and weighted average of 5.2%. Similarly, the statistical analysis conducted on geographies consisting of 301,587,568 people shows a slight positive correlation between the proportion of Immigrants from Jamaica and unemployment in the United States with a correlation coefficient (R) of 0.083 and weighted average of 6.4%, a difference of 22.6%.
Unemployment Correlation Summary
| Measurement | Puget Sound Salish | Immigrants from Jamaica |
| Minimum | 0.50% | 2.5% |
| Maximum | 50.0% | 10.8% |
| Range | 49.5% | 8.3% |
| Mean | 7.8% | 6.6% |
| Median | 5.1% | 6.2% |
| Interquartile 25% (IQ1) | 4.4% | 5.6% |
| Interquartile 75% (IQ3) | 8.1% | 7.5% |
| Interquartile Range (IQR) | 3.7% | 1.9% |
| Standard Deviation (Sample) | 9.7% | 1.6% |
| Standard Deviation (Population) | 9.5% | 1.6% |
Similar Demographics by Unemployment
Demographics Similar to Puget Sound Salish by Unemployment
In terms of unemployment, the demographic groups most similar to Puget Sound Salish are Immigrants from Nicaragua (5.2%, a difference of 0.040%), Immigrants from Morocco (5.2%, a difference of 0.16%), Uruguayan (5.2%, a difference of 0.23%), Immigrants from Vietnam (5.2%, a difference of 0.25%), and Immigrants from Indonesia (5.2%, a difference of 0.29%).
| Demographics | Rating | Rank | Unemployment |
| Immigrants | Colombia | 64.7 /100 | #164 | Good 5.2% |
| Immigrants | Brazil | 63.1 /100 | #165 | Good 5.2% |
| Immigrants | Indonesia | 61.2 /100 | #166 | Good 5.2% |
| Colombians | 61.1 /100 | #167 | Good 5.2% |
| Uruguayans | 60.2 /100 | #168 | Good 5.2% |
| Immigrants | Morocco | 59.1 /100 | #169 | Average 5.2% |
| Immigrants | Nicaragua | 57.1 /100 | #170 | Average 5.2% |
| Puget Sound Salish | 56.6 /100 | #171 | Average 5.2% |
| Immigrants | Vietnam | 52.5 /100 | #172 | Average 5.2% |
| Immigrants | Poland | 51.8 /100 | #173 | Average 5.3% |
| Immigrants | Congo | 50.0 /100 | #174 | Average 5.3% |
| Taiwanese | 49.6 /100 | #175 | Average 5.3% |
| Nicaraguans | 48.7 /100 | #176 | Average 5.3% |
| Immigrants | Nonimmigrants | 47.9 /100 | #177 | Average 5.3% |
| Afghans | 47.4 /100 | #178 | Average 5.3% |
Demographics Similar to Immigrants from Jamaica by Unemployment
In terms of unemployment, the demographic groups most similar to Immigrants from Jamaica are Menominee (6.4%, a difference of 0.25%), Lumbee (6.4%, a difference of 0.29%), Belizean (6.4%, a difference of 0.68%), Immigrants from Bangladesh (6.5%, a difference of 0.77%), and West Indian (6.4%, a difference of 0.91%).
| Demographics | Rating | Rank | Unemployment |
| Jamaicans | 0.0 /100 | #297 | Tragic 6.3% |
| Immigrants | Haiti | 0.0 /100 | #298 | Tragic 6.3% |
| Immigrants | West Indies | 0.0 /100 | #299 | Tragic 6.3% |
| Immigrants | Trinidad and Tobago | 0.0 /100 | #300 | Tragic 6.3% |
| Trinidadians and Tobagonians | 0.0 /100 | #301 | Tragic 6.3% |
| West Indians | 0.0 /100 | #302 | Tragic 6.4% |
| Belizeans | 0.0 /100 | #303 | Tragic 6.4% |
| Immigrants | Jamaica | 0.0 /100 | #304 | Tragic 6.4% |
| Menominee | 0.0 /100 | #305 | Tragic 6.4% |
| Lumbee | 0.0 /100 | #306 | Tragic 6.4% |
| Immigrants | Bangladesh | 0.0 /100 | #307 | Tragic 6.5% |
| Barbadians | 0.0 /100 | #308 | Tragic 6.5% |
| Vietnamese | 0.0 /100 | #309 | Tragic 6.5% |
| Immigrants | Belize | 0.0 /100 | #310 | Tragic 6.5% |
| Cape Verdeans | 0.0 /100 | #311 | Tragic 6.5% |