Immigrants from Western Europe vs Immigrants from Jamaica Child Poverty Under the Age of 5
COMPARE
Immigrants from Western Europe
Immigrants from Jamaica
Child Poverty Under the Age of 5
Child Poverty Under the Age of 5 Comparison
Immigrants from Western Europe
Immigrants from Jamaica
16.5%
CHILD POVERTY UNDER THE AGE OF 5
83.3/ 100
METRIC RATING
141st/ 347
METRIC RANK
20.5%
CHILD POVERTY UNDER THE AGE OF 5
0.1/ 100
METRIC RATING
272nd/ 347
METRIC RANK
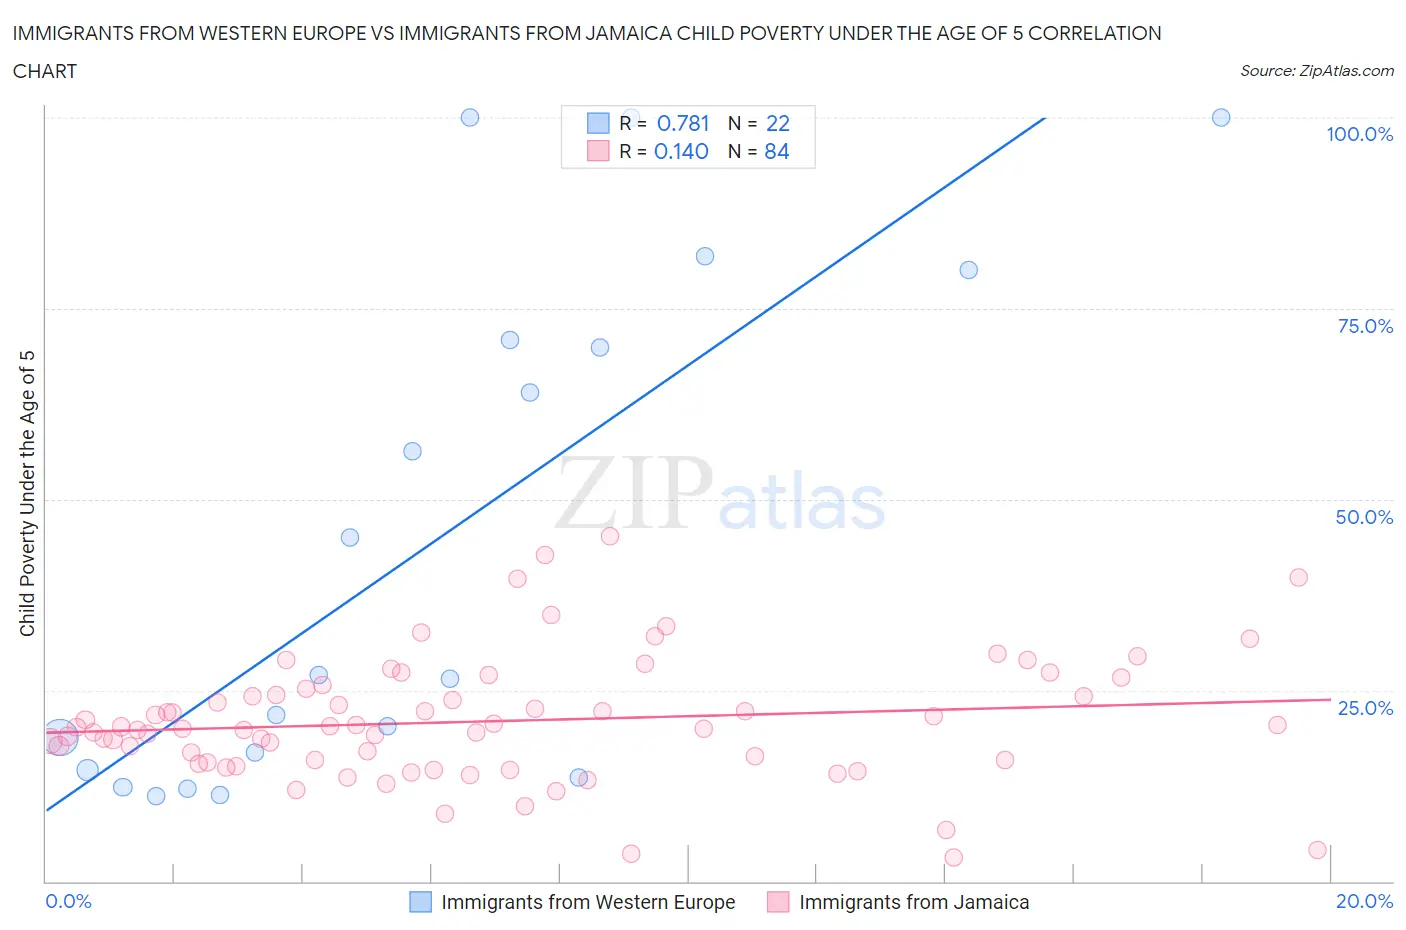
Immigrants from Western Europe vs Immigrants from Jamaica Child Poverty Under the Age of 5 Correlation Chart
The statistical analysis conducted on geographies consisting of 467,153,267 people shows a strong positive correlation between the proportion of Immigrants from Western Europe and poverty level among children under the age of 5 in the United States with a correlation coefficient (R) of 0.781 and weighted average of 16.5%. Similarly, the statistical analysis conducted on geographies consisting of 292,663,090 people shows a poor positive correlation between the proportion of Immigrants from Jamaica and poverty level among children under the age of 5 in the United States with a correlation coefficient (R) of 0.140 and weighted average of 20.5%, a difference of 24.1%.
Child Poverty Under the Age of 5 Correlation Summary
| Measurement | Immigrants from Western Europe | Immigrants from Jamaica |
| Minimum | 11.1% | 3.1% |
| Maximum | 100.0% | 45.2% |
| Range | 88.9% | 42.1% |
| Mean | 44.3% | 21.0% |
| Median | 26.7% | 20.1% |
| Interquartile 25% (IQ1) | 14.6% | 15.7% |
| Interquartile 75% (IQ3) | 70.8% | 24.8% |
| Interquartile Range (IQR) | 56.3% | 9.1% |
| Standard Deviation (Sample) | 33.1% | 8.1% |
| Standard Deviation (Population) | 32.4% | 8.0% |
Similar Demographics by Child Poverty Under the Age of 5
Demographics Similar to Immigrants from Western Europe by Child Poverty Under the Age of 5
In terms of child poverty under the age of 5, the demographic groups most similar to Immigrants from Western Europe are Portuguese (16.5%, a difference of 0.040%), Samoan (16.5%, a difference of 0.050%), Ethiopian (16.5%, a difference of 0.11%), Guamanian/Chamorro (16.5%, a difference of 0.19%), and Immigrants from Ethiopia (16.6%, a difference of 0.22%).
| Demographics | Rating | Rank | Child Poverty Under the Age of 5 |
| Immigrants | North Macedonia | 87.8 /100 | #134 | Excellent 16.4% |
| Brazilians | 87.8 /100 | #135 | Excellent 16.4% |
| Immigrants | Northern Africa | 87.5 /100 | #136 | Excellent 16.4% |
| Immigrants | Chile | 85.3 /100 | #137 | Excellent 16.4% |
| Germans | 84.8 /100 | #138 | Excellent 16.5% |
| Immigrants | Hungary | 84.5 /100 | #139 | Excellent 16.5% |
| Guamanians/Chamorros | 84.2 /100 | #140 | Excellent 16.5% |
| Immigrants | Western Europe | 83.3 /100 | #141 | Excellent 16.5% |
| Portuguese | 83.0 /100 | #142 | Excellent 16.5% |
| Samoans | 83.0 /100 | #143 | Excellent 16.5% |
| Ethiopians | 82.7 /100 | #144 | Excellent 16.5% |
| Immigrants | Ethiopia | 82.1 /100 | #145 | Excellent 16.6% |
| Israelis | 82.0 /100 | #146 | Excellent 16.6% |
| Immigrants | Nepal | 80.3 /100 | #147 | Excellent 16.6% |
| Syrians | 79.1 /100 | #148 | Good 16.6% |
Demographics Similar to Immigrants from Jamaica by Child Poverty Under the Age of 5
In terms of child poverty under the age of 5, the demographic groups most similar to Immigrants from Jamaica are American (20.5%, a difference of 0.12%), Central American (20.6%, a difference of 0.52%), Jamaican (20.4%, a difference of 0.57%), Immigrants from Belize (20.6%, a difference of 0.62%), and Immigrants from Burma/Myanmar (20.4%, a difference of 0.65%).
| Demographics | Rating | Rank | Child Poverty Under the Age of 5 |
| Spanish American Indians | 0.1 /100 | #265 | Tragic 20.2% |
| Aleuts | 0.1 /100 | #266 | Tragic 20.3% |
| Ottawa | 0.1 /100 | #267 | Tragic 20.3% |
| Belizeans | 0.1 /100 | #268 | Tragic 20.3% |
| Immigrants | Burma/Myanmar | 0.1 /100 | #269 | Tragic 20.4% |
| Jamaicans | 0.1 /100 | #270 | Tragic 20.4% |
| Americans | 0.1 /100 | #271 | Tragic 20.5% |
| Immigrants | Jamaica | 0.1 /100 | #272 | Tragic 20.5% |
| Central Americans | 0.1 /100 | #273 | Tragic 20.6% |
| Immigrants | Belize | 0.1 /100 | #274 | Tragic 20.6% |
| Bangladeshis | 0.1 /100 | #275 | Tragic 20.6% |
| West Indians | 0.0 /100 | #276 | Tragic 20.6% |
| Immigrants | West Indies | 0.0 /100 | #277 | Tragic 20.7% |
| Immigrants | Grenada | 0.0 /100 | #278 | Tragic 20.7% |
| Sub-Saharan Africans | 0.0 /100 | #279 | Tragic 20.8% |