Immigrants from Central America vs Colville Child Poverty Under the Age of 5
COMPARE
Immigrants from Central America
Colville
Child Poverty Under the Age of 5
Child Poverty Under the Age of 5 Comparison
Immigrants from Central America
Colville
22.0%
CHILD POVERTY UNDER THE AGE OF 5
0.0/ 100
METRIC RATING
301st/ 347
METRIC RANK
25.7%
CHILD POVERTY UNDER THE AGE OF 5
0.0/ 100
METRIC RATING
335th/ 347
METRIC RANK
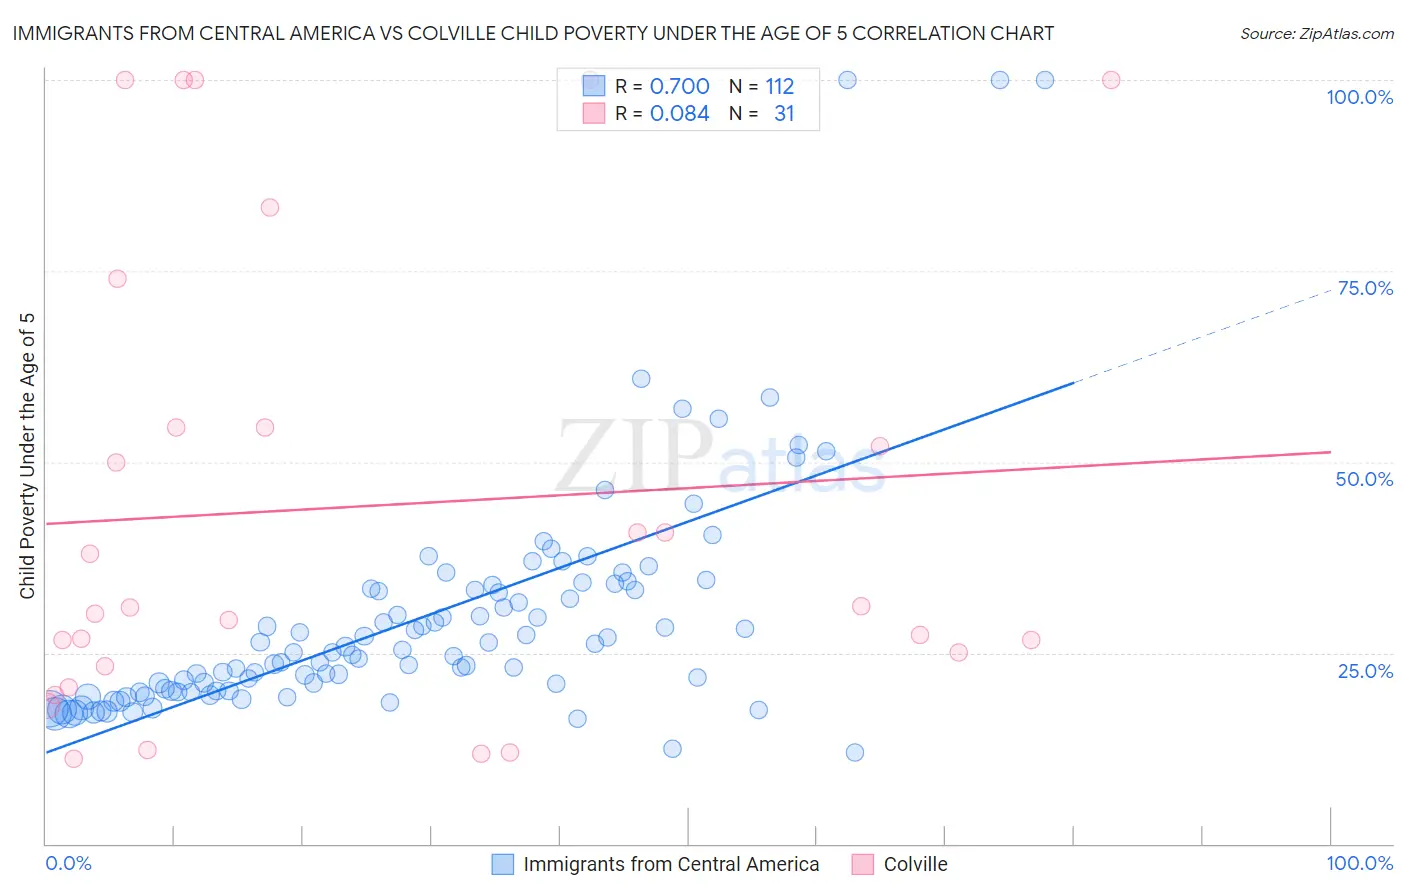
Immigrants from Central America vs Colville Child Poverty Under the Age of 5 Correlation Chart
The statistical analysis conducted on geographies consisting of 506,999,696 people shows a strong positive correlation between the proportion of Immigrants from Central America and poverty level among children under the age of 5 in the United States with a correlation coefficient (R) of 0.700 and weighted average of 22.0%. Similarly, the statistical analysis conducted on geographies consisting of 34,435,205 people shows a slight positive correlation between the proportion of Colville and poverty level among children under the age of 5 in the United States with a correlation coefficient (R) of 0.084 and weighted average of 25.7%, a difference of 16.9%.
Child Poverty Under the Age of 5 Correlation Summary
| Measurement | Immigrants from Central America | Colville |
| Minimum | 11.9% | 11.1% |
| Maximum | 100.0% | 100.0% |
| Range | 88.1% | 88.9% |
| Mean | 29.4% | 44.2% |
| Median | 25.1% | 30.9% |
| Interquartile 25% (IQ1) | 20.0% | 23.2% |
| Interquartile 75% (IQ3) | 33.4% | 54.5% |
| Interquartile Range (IQR) | 13.4% | 31.3% |
| Standard Deviation (Sample) | 15.4% | 30.1% |
| Standard Deviation (Population) | 15.4% | 29.6% |
Similar Demographics by Child Poverty Under the Age of 5
Demographics Similar to Immigrants from Central America by Child Poverty Under the Age of 5
In terms of child poverty under the age of 5, the demographic groups most similar to Immigrants from Central America are Iroquois (22.0%, a difference of 0.17%), Inupiat (22.0%, a difference of 0.25%), Immigrants from Guatemala (22.0%, a difference of 0.36%), Alaskan Athabascan (21.8%, a difference of 0.66%), and Blackfeet (21.8%, a difference of 0.67%).
| Demographics | Rating | Rank | Child Poverty Under the Age of 5 |
| Guatemalans | 0.0 /100 | #294 | Tragic 21.6% |
| Cherokee | 0.0 /100 | #295 | Tragic 21.7% |
| Yaqui | 0.0 /100 | #296 | Tragic 21.7% |
| Hispanics or Latinos | 0.0 /100 | #297 | Tragic 21.7% |
| Blackfeet | 0.0 /100 | #298 | Tragic 21.8% |
| Chickasaw | 0.0 /100 | #299 | Tragic 21.8% |
| Alaskan Athabascans | 0.0 /100 | #300 | Tragic 21.8% |
| Immigrants | Central America | 0.0 /100 | #301 | Tragic 22.0% |
| Iroquois | 0.0 /100 | #302 | Tragic 22.0% |
| Inupiat | 0.0 /100 | #303 | Tragic 22.0% |
| Immigrants | Guatemala | 0.0 /100 | #304 | Tragic 22.0% |
| Immigrants | Mexico | 0.0 /100 | #305 | Tragic 22.2% |
| Indonesians | 0.0 /100 | #306 | Tragic 22.3% |
| Immigrants | Bahamas | 0.0 /100 | #307 | Tragic 22.7% |
| Immigrants | Dominica | 0.0 /100 | #308 | Tragic 22.7% |
Demographics Similar to Colville by Child Poverty Under the Age of 5
In terms of child poverty under the age of 5, the demographic groups most similar to Colville are Black/African American (25.7%, a difference of 0.0%), Native/Alaskan (25.6%, a difference of 0.50%), Apache (25.0%, a difference of 2.8%), Sioux (26.9%, a difference of 4.9%), and Kiowa (24.5%, a difference of 5.0%).
| Demographics | Rating | Rank | Child Poverty Under the Age of 5 |
| Immigrants | Dominican Republic | 0.0 /100 | #328 | Tragic 24.1% |
| Cajuns | 0.0 /100 | #329 | Tragic 24.1% |
| Creek | 0.0 /100 | #330 | Tragic 24.2% |
| Kiowa | 0.0 /100 | #331 | Tragic 24.5% |
| Apache | 0.0 /100 | #332 | Tragic 25.0% |
| Natives/Alaskans | 0.0 /100 | #333 | Tragic 25.6% |
| Blacks/African Americans | 0.0 /100 | #334 | Tragic 25.7% |
| Colville | 0.0 /100 | #335 | Tragic 25.7% |
| Sioux | 0.0 /100 | #336 | Tragic 26.9% |
| Pima | 0.0 /100 | #337 | Tragic 27.4% |
| Hopi | 0.0 /100 | #338 | Tragic 27.7% |
| Yup'ik | 0.0 /100 | #339 | Tragic 27.7% |
| Cheyenne | 0.0 /100 | #340 | Tragic 28.3% |
| Immigrants | Yemen | 0.0 /100 | #341 | Tragic 29.3% |
| Tohono O'odham | 0.0 /100 | #342 | Tragic 29.5% |