Puget Sound Salish vs Colville Vision Disability
COMPARE
Puget Sound Salish
Colville
Vision Disability
Vision Disability Comparison
Puget Sound Salish
Colville
2.5%
VISION DISABILITY
0.0/ 100
METRIC RATING
283rd/ 347
METRIC RANK
3.0%
VISION DISABILITY
0.0/ 100
METRIC RATING
330th/ 347
METRIC RANK
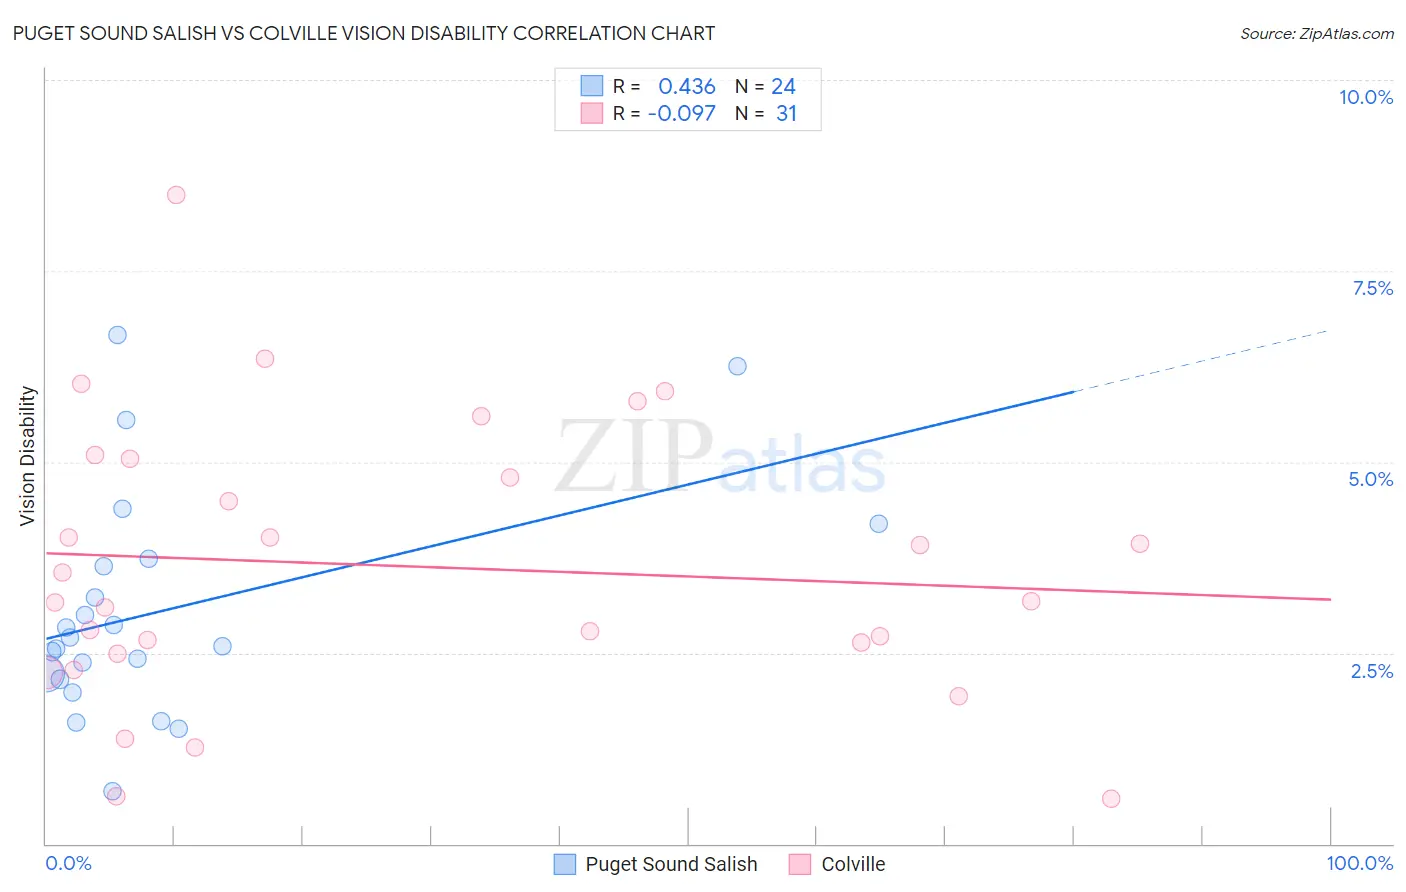
Puget Sound Salish vs Colville Vision Disability Correlation Chart
The statistical analysis conducted on geographies consisting of 46,150,765 people shows a moderate positive correlation between the proportion of Puget Sound Salish and percentage of population with vision disability in the United States with a correlation coefficient (R) of 0.436 and weighted average of 2.5%. Similarly, the statistical analysis conducted on geographies consisting of 34,683,927 people shows a slight negative correlation between the proportion of Colville and percentage of population with vision disability in the United States with a correlation coefficient (R) of -0.097 and weighted average of 3.0%, a difference of 23.1%.
Vision Disability Correlation Summary
| Measurement | Puget Sound Salish | Colville |
| Minimum | 0.69% | 0.59% |
| Maximum | 6.7% | 8.5% |
| Range | 6.0% | 7.9% |
| Mean | 3.1% | 3.6% |
| Median | 2.6% | 3.2% |
| Interquartile 25% (IQ1) | 2.2% | 2.5% |
| Interquartile 75% (IQ3) | 3.7% | 5.0% |
| Interquartile Range (IQR) | 1.5% | 2.5% |
| Standard Deviation (Sample) | 1.5% | 1.8% |
| Standard Deviation (Population) | 1.4% | 1.8% |
Similar Demographics by Vision Disability
Demographics Similar to Puget Sound Salish by Vision Disability
In terms of vision disability, the demographic groups most similar to Puget Sound Salish are Immigrants from Caribbean (2.5%, a difference of 0.13%), U.S. Virgin Islander (2.5%, a difference of 0.25%), Yakama (2.5%, a difference of 0.28%), Immigrants from Central America (2.5%, a difference of 0.30%), and Sioux (2.5%, a difference of 0.31%).
| Demographics | Rating | Rank | Vision Disability |
| Scotch-Irish | 0.0 /100 | #276 | Tragic 2.4% |
| Bahamians | 0.0 /100 | #277 | Tragic 2.4% |
| Spanish | 0.0 /100 | #278 | Tragic 2.4% |
| Nepalese | 0.0 /100 | #279 | Tragic 2.4% |
| Cape Verdeans | 0.0 /100 | #280 | Tragic 2.4% |
| U.S. Virgin Islanders | 0.0 /100 | #281 | Tragic 2.5% |
| Immigrants | Caribbean | 0.0 /100 | #282 | Tragic 2.5% |
| Puget Sound Salish | 0.0 /100 | #283 | Tragic 2.5% |
| Yakama | 0.0 /100 | #284 | Tragic 2.5% |
| Immigrants | Central America | 0.0 /100 | #285 | Tragic 2.5% |
| Sioux | 0.0 /100 | #286 | Tragic 2.5% |
| Hondurans | 0.0 /100 | #287 | Tragic 2.5% |
| French American Indians | 0.0 /100 | #288 | Tragic 2.5% |
| Immigrants | Nonimmigrants | 0.0 /100 | #289 | Tragic 2.5% |
| Immigrants | Cuba | 0.0 /100 | #290 | Tragic 2.5% |
Demographics Similar to Colville by Vision Disability
In terms of vision disability, the demographic groups most similar to Colville are Central American Indian (3.0%, a difference of 0.64%), Seminole (3.1%, a difference of 1.1%), Cajun (3.1%, a difference of 1.1%), Apache (3.0%, a difference of 1.2%), and Yuman (3.0%, a difference of 1.4%).
| Demographics | Rating | Rank | Vision Disability |
| Tlingit-Haida | 0.0 /100 | #323 | Tragic 2.9% |
| Hopi | 0.0 /100 | #324 | Tragic 2.9% |
| Cherokee | 0.0 /100 | #325 | Tragic 2.9% |
| Spanish Americans | 0.0 /100 | #326 | Tragic 2.9% |
| Natives/Alaskans | 0.0 /100 | #327 | Tragic 3.0% |
| Yuman | 0.0 /100 | #328 | Tragic 3.0% |
| Apache | 0.0 /100 | #329 | Tragic 3.0% |
| Colville | 0.0 /100 | #330 | Tragic 3.0% |
| Central American Indians | 0.0 /100 | #331 | Tragic 3.0% |
| Seminole | 0.0 /100 | #332 | Tragic 3.1% |
| Cajuns | 0.0 /100 | #333 | Tragic 3.1% |
| Cheyenne | 0.0 /100 | #334 | Tragic 3.1% |
| Navajo | 0.0 /100 | #335 | Tragic 3.1% |
| Alaskan Athabascans | 0.0 /100 | #336 | Tragic 3.1% |
| Dutch West Indians | 0.0 /100 | #337 | Tragic 3.2% |