Puerto Rican vs Italian Family Households
COMPARE
Puerto Rican
Italian
Family Households
Family Households Comparison
Puerto Ricans
Italians
64.2%
FAMILY HOUSEHOLDS
33.4/ 100
METRIC RATING
184th/ 347
METRIC RANK
64.8%
FAMILY HOUSEHOLDS
91.9/ 100
METRIC RATING
128th/ 347
METRIC RANK
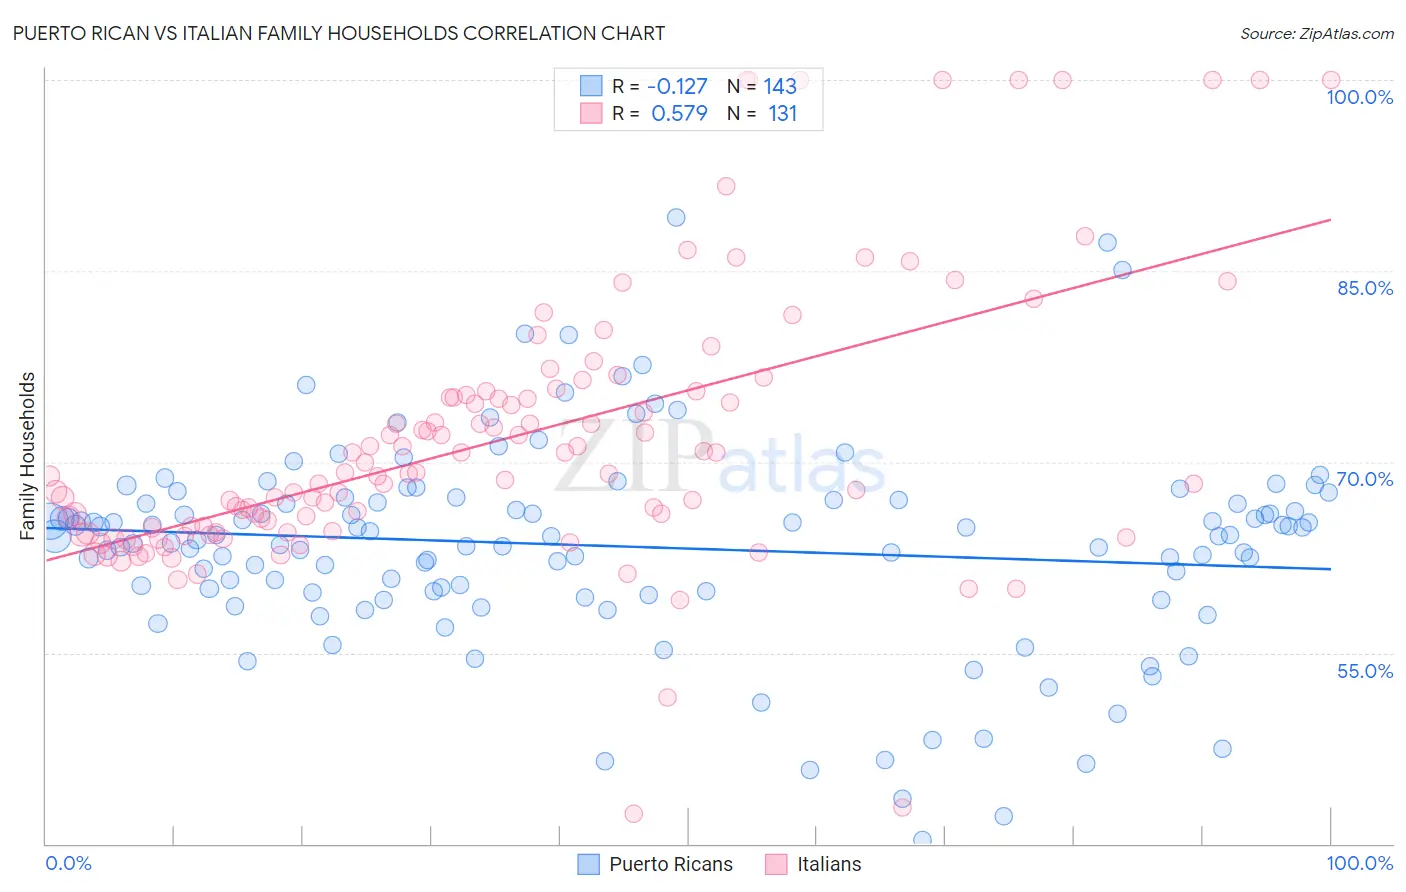
Puerto Rican vs Italian Family Households Correlation Chart
The statistical analysis conducted on geographies consisting of 527,724,488 people shows a poor negative correlation between the proportion of Puerto Ricans and percentage of family households in the United States with a correlation coefficient (R) of -0.127 and weighted average of 64.2%. Similarly, the statistical analysis conducted on geographies consisting of 574,452,488 people shows a substantial positive correlation between the proportion of Italians and percentage of family households in the United States with a correlation coefficient (R) of 0.579 and weighted average of 64.8%, a difference of 1.1%.
Family Households Correlation Summary
| Measurement | Puerto Rican | Italian |
| Minimum | 40.3% | 42.4% |
| Maximum | 89.2% | 100.0% |
| Range | 48.9% | 57.6% |
| Mean | 63.4% | 71.7% |
| Median | 64.2% | 69.1% |
| Interquartile 25% (IQ1) | 59.9% | 64.5% |
| Interquartile 75% (IQ3) | 67.0% | 75.2% |
| Interquartile Range (IQR) | 7.1% | 10.7% |
| Standard Deviation (Sample) | 8.0% | 10.9% |
| Standard Deviation (Population) | 8.0% | 10.8% |
Similar Demographics by Family Households
Demographics Similar to Puerto Ricans by Family Households
In terms of family households, the demographic groups most similar to Puerto Ricans are Creek (64.2%, a difference of 0.010%), Immigrants from Honduras (64.2%, a difference of 0.020%), Immigrants from Trinidad and Tobago (64.2%, a difference of 0.020%), Ukrainian (64.2%, a difference of 0.020%), and Immigrants from Iran (64.1%, a difference of 0.050%).
| Demographics | Rating | Rank | Family Households |
| Immigrants | Micronesia | 42.3 /100 | #177 | Average 64.2% |
| Jamaicans | 40.6 /100 | #178 | Average 64.2% |
| Immigrants | Ukraine | 38.2 /100 | #179 | Fair 64.2% |
| Immigrants | Honduras | 35.0 /100 | #180 | Fair 64.2% |
| Immigrants | Trinidad and Tobago | 34.9 /100 | #181 | Fair 64.2% |
| Ukrainians | 34.6 /100 | #182 | Fair 64.2% |
| Creek | 34.1 /100 | #183 | Fair 64.2% |
| Puerto Ricans | 33.4 /100 | #184 | Fair 64.2% |
| Immigrants | Iran | 30.4 /100 | #185 | Fair 64.1% |
| Spanish Americans | 30.1 /100 | #186 | Fair 64.1% |
| Northern Europeans | 28.2 /100 | #187 | Fair 64.1% |
| Paraguayans | 26.7 /100 | #188 | Fair 64.1% |
| Immigrants | Western Asia | 25.3 /100 | #189 | Fair 64.1% |
| Zimbabweans | 24.7 /100 | #190 | Fair 64.1% |
| Arabs | 24.5 /100 | #191 | Fair 64.1% |
Demographics Similar to Italians by Family Households
In terms of family households, the demographic groups most similar to Italians are Immigrants from Panama (64.8%, a difference of 0.010%), Panamanian (64.8%, a difference of 0.020%), Immigrants from Ecuador (64.8%, a difference of 0.020%), Immigrants from Argentina (64.9%, a difference of 0.040%), and Immigrants from Belize (64.9%, a difference of 0.040%).
| Demographics | Rating | Rank | Family Households |
| Hungarians | 94.0 /100 | #121 | Exceptional 64.9% |
| Hmong | 93.4 /100 | #122 | Exceptional 64.9% |
| Choctaw | 93.4 /100 | #123 | Exceptional 64.9% |
| Immigrants | Argentina | 92.8 /100 | #124 | Exceptional 64.9% |
| Immigrants | Belize | 92.7 /100 | #125 | Exceptional 64.9% |
| Panamanians | 92.4 /100 | #126 | Exceptional 64.8% |
| Immigrants | Panama | 92.0 /100 | #127 | Exceptional 64.8% |
| Italians | 91.9 /100 | #128 | Exceptional 64.8% |
| Immigrants | Ecuador | 91.4 /100 | #129 | Exceptional 64.8% |
| Immigrants | Italy | 90.2 /100 | #130 | Exceptional 64.8% |
| Immigrants | Nonimmigrants | 90.1 /100 | #131 | Exceptional 64.8% |
| Cajuns | 89.4 /100 | #132 | Excellent 64.8% |
| Belizeans | 89.3 /100 | #133 | Excellent 64.8% |
| Greeks | 88.1 /100 | #134 | Excellent 64.7% |
| Maltese | 87.4 /100 | #135 | Excellent 64.7% |