Puerto Rican vs Immigrants from Liberia Male Poverty
COMPARE
Puerto Rican
Immigrants from Liberia
Male Poverty
Male Poverty Comparison
Puerto Ricans
Immigrants from Liberia
22.0%
MALE POVERTY
0.0/ 100
METRIC RATING
345th/ 347
METRIC RANK
13.0%
MALE POVERTY
0.1/ 100
METRIC RATING
255th/ 347
METRIC RANK
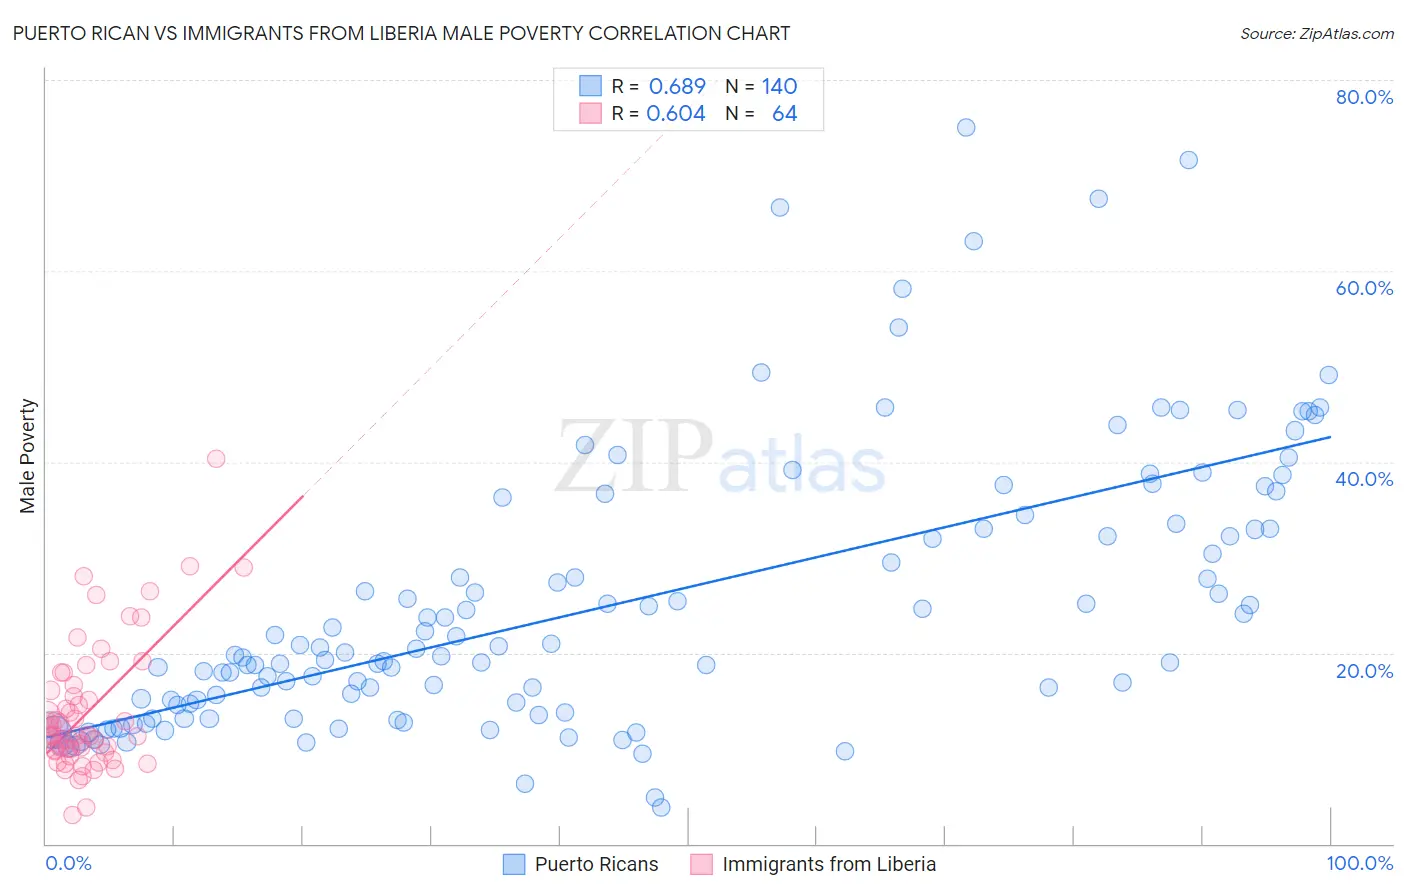
Puerto Rican vs Immigrants from Liberia Male Poverty Correlation Chart
The statistical analysis conducted on geographies consisting of 527,291,873 people shows a significant positive correlation between the proportion of Puerto Ricans and poverty level among males in the United States with a correlation coefficient (R) of 0.689 and weighted average of 22.0%. Similarly, the statistical analysis conducted on geographies consisting of 135,246,514 people shows a significant positive correlation between the proportion of Immigrants from Liberia and poverty level among males in the United States with a correlation coefficient (R) of 0.604 and weighted average of 13.0%, a difference of 69.6%.
Male Poverty Correlation Summary
| Measurement | Puerto Rican | Immigrants from Liberia |
| Minimum | 3.8% | 3.0% |
| Maximum | 75.1% | 40.3% |
| Range | 71.3% | 37.2% |
| Mean | 25.0% | 13.8% |
| Median | 19.9% | 11.4% |
| Interquartile 25% (IQ1) | 14.1% | 9.8% |
| Interquartile 75% (IQ3) | 33.0% | 16.4% |
| Interquartile Range (IQR) | 18.8% | 6.6% |
| Standard Deviation (Sample) | 14.4% | 6.8% |
| Standard Deviation (Population) | 14.4% | 6.8% |
Similar Demographics by Male Poverty
Demographics Similar to Puerto Ricans by Male Poverty
In terms of male poverty, the demographic groups most similar to Puerto Ricans are Navajo (22.3%, a difference of 1.3%), Tohono O'odham (22.9%, a difference of 3.9%), Hopi (20.8%, a difference of 5.9%), Yup'ik (20.4%, a difference of 8.1%), and Pima (20.4%, a difference of 8.2%).
| Demographics | Rating | Rank | Male Poverty |
| Natives/Alaskans | 0.0 /100 | #333 | Tragic 16.9% |
| Cheyenne | 0.0 /100 | #334 | Tragic 17.6% |
| Apache | 0.0 /100 | #335 | Tragic 17.7% |
| Pueblo | 0.0 /100 | #336 | Tragic 18.5% |
| Sioux | 0.0 /100 | #337 | Tragic 18.7% |
| Crow | 0.0 /100 | #338 | Tragic 19.1% |
| Yuman | 0.0 /100 | #339 | Tragic 19.5% |
| Immigrants | Yemen | 0.0 /100 | #340 | Tragic 20.1% |
| Lumbee | 0.0 /100 | #341 | Tragic 20.2% |
| Pima | 0.0 /100 | #342 | Tragic 20.4% |
| Yup'ik | 0.0 /100 | #343 | Tragic 20.4% |
| Hopi | 0.0 /100 | #344 | Tragic 20.8% |
| Puerto Ricans | 0.0 /100 | #345 | Tragic 22.0% |
| Navajo | 0.0 /100 | #346 | Tragic 22.3% |
| Tohono O'odham | 0.0 /100 | #347 | Tragic 22.9% |
Demographics Similar to Immigrants from Liberia by Male Poverty
In terms of male poverty, the demographic groups most similar to Immigrants from Liberia are Mexican American Indian (13.0%, a difference of 0.090%), Immigrants from Burma/Myanmar (13.0%, a difference of 0.20%), Immigrants from Ghana (12.9%, a difference of 0.47%), Immigrants from Trinidad and Tobago (13.1%, a difference of 0.47%), and Immigrants from Ecuador (12.9%, a difference of 0.53%).
| Demographics | Rating | Rank | Male Poverty |
| Immigrants | Sudan | 0.2 /100 | #248 | Tragic 12.9% |
| Potawatomi | 0.2 /100 | #249 | Tragic 12.9% |
| Immigrants | Nicaragua | 0.2 /100 | #250 | Tragic 12.9% |
| Immigrants | Cuba | 0.2 /100 | #251 | Tragic 12.9% |
| Immigrants | Ecuador | 0.2 /100 | #252 | Tragic 12.9% |
| Immigrants | Ghana | 0.2 /100 | #253 | Tragic 12.9% |
| Mexican American Indians | 0.1 /100 | #254 | Tragic 13.0% |
| Immigrants | Liberia | 0.1 /100 | #255 | Tragic 13.0% |
| Immigrants | Burma/Myanmar | 0.1 /100 | #256 | Tragic 13.0% |
| Immigrants | Trinidad and Tobago | 0.1 /100 | #257 | Tragic 13.1% |
| Cape Verdeans | 0.1 /100 | #258 | Tragic 13.1% |
| Cherokee | 0.1 /100 | #259 | Tragic 13.1% |
| Ottawa | 0.1 /100 | #260 | Tragic 13.1% |
| Trinidadians and Tobagonians | 0.1 /100 | #261 | Tragic 13.1% |
| Spanish American Indians | 0.1 /100 | #262 | Tragic 13.1% |