Puerto Rican vs Immigrants from Central America Male Poverty
COMPARE
Puerto Rican
Immigrants from Central America
Male Poverty
Male Poverty Comparison
Puerto Ricans
Immigrants from Central America
22.0%
MALE POVERTY
0.0/ 100
METRIC RATING
345th/ 347
METRIC RANK
13.9%
MALE POVERTY
0.0/ 100
METRIC RATING
295th/ 347
METRIC RANK
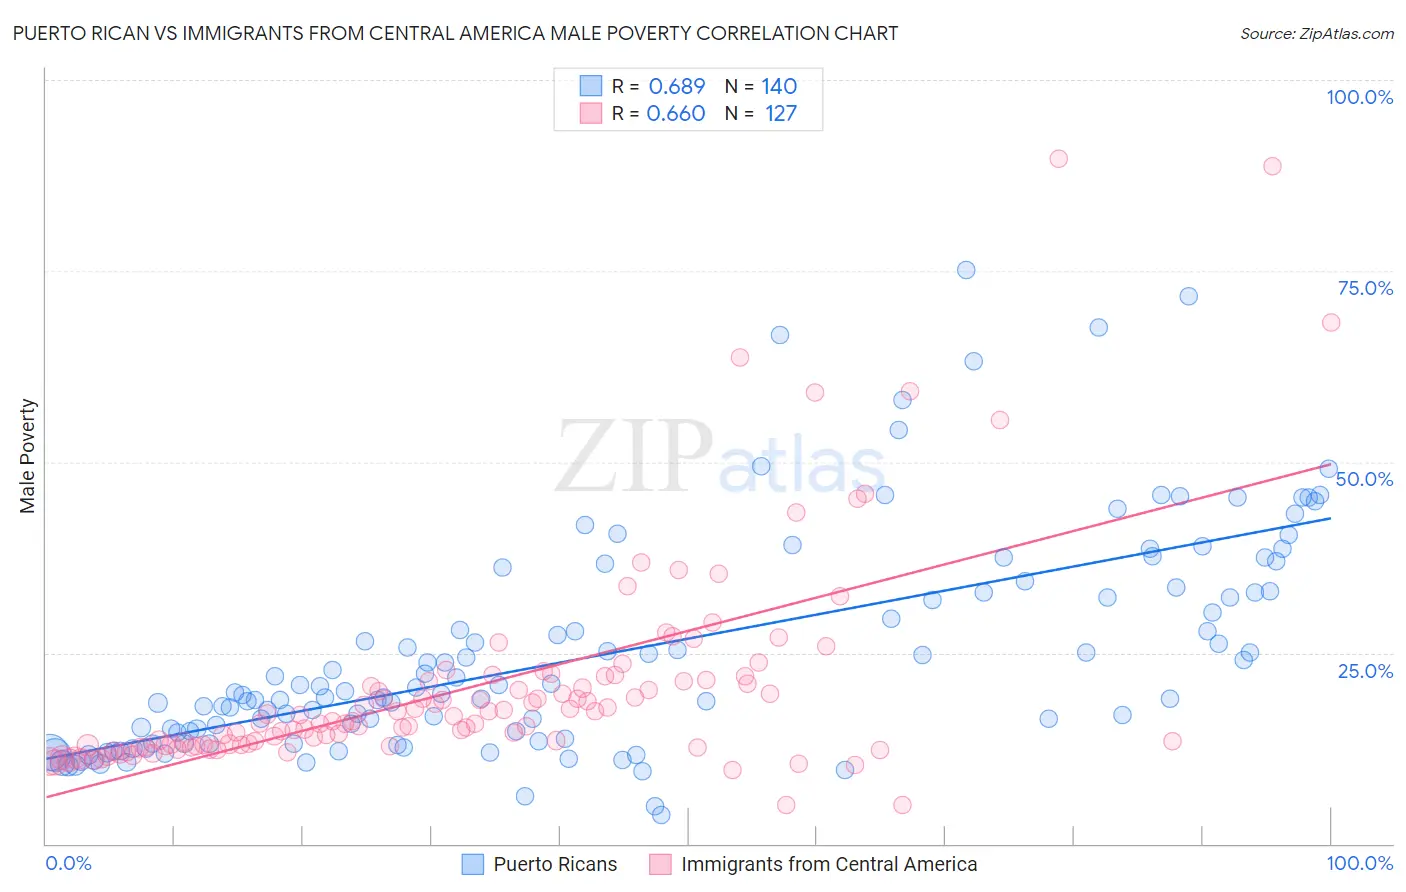
Puerto Rican vs Immigrants from Central America Male Poverty Correlation Chart
The statistical analysis conducted on geographies consisting of 527,291,873 people shows a significant positive correlation between the proportion of Puerto Ricans and poverty level among males in the United States with a correlation coefficient (R) of 0.689 and weighted average of 22.0%. Similarly, the statistical analysis conducted on geographies consisting of 535,621,488 people shows a significant positive correlation between the proportion of Immigrants from Central America and poverty level among males in the United States with a correlation coefficient (R) of 0.660 and weighted average of 13.9%, a difference of 58.6%.
Male Poverty Correlation Summary
| Measurement | Puerto Rican | Immigrants from Central America |
| Minimum | 3.8% | 5.0% |
| Maximum | 75.1% | 89.7% |
| Range | 71.3% | 84.7% |
| Mean | 25.0% | 20.6% |
| Median | 19.9% | 16.1% |
| Interquartile 25% (IQ1) | 14.1% | 12.9% |
| Interquartile 75% (IQ3) | 33.0% | 21.5% |
| Interquartile Range (IQR) | 18.8% | 8.5% |
| Standard Deviation (Sample) | 14.4% | 14.1% |
| Standard Deviation (Population) | 14.4% | 14.0% |
Similar Demographics by Male Poverty
Demographics Similar to Puerto Ricans by Male Poverty
In terms of male poverty, the demographic groups most similar to Puerto Ricans are Navajo (22.3%, a difference of 1.3%), Tohono O'odham (22.9%, a difference of 3.9%), Hopi (20.8%, a difference of 5.9%), Yup'ik (20.4%, a difference of 8.1%), and Pima (20.4%, a difference of 8.2%).
| Demographics | Rating | Rank | Male Poverty |
| Natives/Alaskans | 0.0 /100 | #333 | Tragic 16.9% |
| Cheyenne | 0.0 /100 | #334 | Tragic 17.6% |
| Apache | 0.0 /100 | #335 | Tragic 17.7% |
| Pueblo | 0.0 /100 | #336 | Tragic 18.5% |
| Sioux | 0.0 /100 | #337 | Tragic 18.7% |
| Crow | 0.0 /100 | #338 | Tragic 19.1% |
| Yuman | 0.0 /100 | #339 | Tragic 19.5% |
| Immigrants | Yemen | 0.0 /100 | #340 | Tragic 20.1% |
| Lumbee | 0.0 /100 | #341 | Tragic 20.2% |
| Pima | 0.0 /100 | #342 | Tragic 20.4% |
| Yup'ik | 0.0 /100 | #343 | Tragic 20.4% |
| Hopi | 0.0 /100 | #344 | Tragic 20.8% |
| Puerto Ricans | 0.0 /100 | #345 | Tragic 22.0% |
| Navajo | 0.0 /100 | #346 | Tragic 22.3% |
| Tohono O'odham | 0.0 /100 | #347 | Tragic 22.9% |
Demographics Similar to Immigrants from Central America by Male Poverty
In terms of male poverty, the demographic groups most similar to Immigrants from Central America are Cajun (13.9%, a difference of 0.11%), Hispanic or Latino (13.9%, a difference of 0.28%), Immigrants from Belize (13.8%, a difference of 0.34%), Indonesian (13.8%, a difference of 0.35%), and Vietnamese (13.8%, a difference of 0.52%).
| Demographics | Rating | Rank | Male Poverty |
| Immigrants | St. Vincent and the Grenadines | 0.0 /100 | #288 | Tragic 13.8% |
| Guatemalans | 0.0 /100 | #289 | Tragic 13.8% |
| Immigrants | Zaire | 0.0 /100 | #290 | Tragic 13.8% |
| Vietnamese | 0.0 /100 | #291 | Tragic 13.8% |
| Indonesians | 0.0 /100 | #292 | Tragic 13.8% |
| Immigrants | Belize | 0.0 /100 | #293 | Tragic 13.8% |
| Hispanics or Latinos | 0.0 /100 | #294 | Tragic 13.9% |
| Immigrants | Central America | 0.0 /100 | #295 | Tragic 13.9% |
| Cajuns | 0.0 /100 | #296 | Tragic 13.9% |
| Inupiat | 0.0 /100 | #297 | Tragic 14.0% |
| Blackfeet | 0.0 /100 | #298 | Tragic 14.0% |
| Immigrants | Guatemala | 0.0 /100 | #299 | Tragic 14.0% |
| Immigrants | Mexico | 0.0 /100 | #300 | Tragic 14.0% |
| Immigrants | Senegal | 0.0 /100 | #301 | Tragic 14.0% |
| Immigrants | Caribbean | 0.0 /100 | #302 | Tragic 14.0% |