Puerto Rican vs Immigrants from Liberia Median Female Earnings
COMPARE
Puerto Rican
Immigrants from Liberia
Median Female Earnings
Median Female Earnings Comparison
Puerto Ricans
Immigrants from Liberia
$31,560
MEDIAN FEMALE EARNINGS
0.0/ 100
METRIC RATING
345th/ 347
METRIC RANK
$37,970
MEDIAN FEMALE EARNINGS
2.7/ 100
METRIC RATING
244th/ 347
METRIC RANK
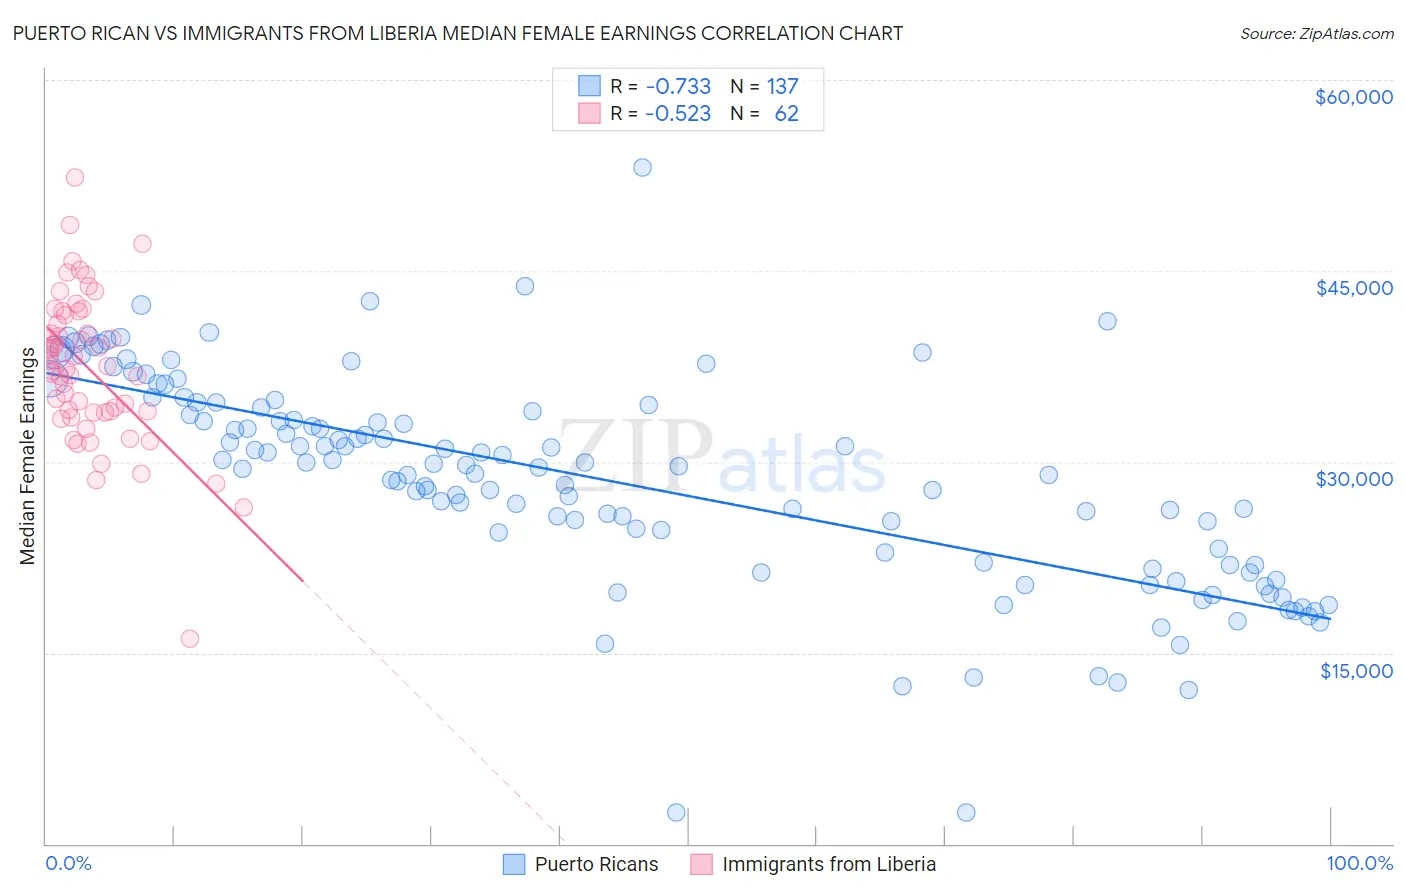
Puerto Rican vs Immigrants from Liberia Median Female Earnings Correlation Chart
The statistical analysis conducted on geographies consisting of 527,573,367 people shows a strong negative correlation between the proportion of Puerto Ricans and median female earnings in the United States with a correlation coefficient (R) of -0.733 and weighted average of $31,560. Similarly, the statistical analysis conducted on geographies consisting of 135,268,038 people shows a substantial negative correlation between the proportion of Immigrants from Liberia and median female earnings in the United States with a correlation coefficient (R) of -0.523 and weighted average of $37,970, a difference of 20.3%.
Median Female Earnings Correlation Summary
| Measurement | Puerto Rican | Immigrants from Liberia |
| Minimum | $2,499 | $16,076 |
| Maximum | $53,092 | $52,381 |
| Range | $50,593 | $36,305 |
| Mean | $28,571 | $37,357 |
| Median | $29,640 | $37,425 |
| Interquartile 25% (IQ1) | $21,994 | $33,898 |
| Interquartile 75% (IQ3) | $34,369 | $41,557 |
| Interquartile Range (IQR) | $12,375 | $7,659 |
| Standard Deviation (Sample) | $8,353 | $5,953 |
| Standard Deviation (Population) | $8,323 | $5,904 |
Similar Demographics by Median Female Earnings
Demographics Similar to Puerto Ricans by Median Female Earnings
In terms of median female earnings, the demographic groups most similar to Puerto Ricans are Arapaho ($31,489, a difference of 0.23%), Lumbee ($32,500, a difference of 3.0%), Pueblo ($32,564, a difference of 3.2%), Yup'ik ($32,730, a difference of 3.7%), and Houma ($30,343, a difference of 4.0%).
| Demographics | Rating | Rank | Median Female Earnings |
| Mexicans | 0.0 /100 | #333 | Tragic $33,664 |
| Spanish American Indians | 0.0 /100 | #334 | Tragic $33,625 |
| Creek | 0.0 /100 | #335 | Tragic $33,437 |
| Ottawa | 0.0 /100 | #336 | Tragic $33,378 |
| Yakama | 0.0 /100 | #337 | Tragic $33,354 |
| Immigrants | Cuba | 0.0 /100 | #338 | Tragic $33,291 |
| Immigrants | Mexico | 0.0 /100 | #339 | Tragic $33,236 |
| Tohono O'odham | 0.0 /100 | #340 | Tragic $33,205 |
| Navajo | 0.0 /100 | #341 | Tragic $33,046 |
| Yup'ik | 0.0 /100 | #342 | Tragic $32,730 |
| Pueblo | 0.0 /100 | #343 | Tragic $32,564 |
| Lumbee | 0.0 /100 | #344 | Tragic $32,500 |
| Puerto Ricans | 0.0 /100 | #345 | Tragic $31,560 |
| Arapaho | 0.0 /100 | #346 | Tragic $31,489 |
| Houma | 0.0 /100 | #347 | Tragic $30,343 |
Demographics Similar to Immigrants from Liberia by Median Female Earnings
In terms of median female earnings, the demographic groups most similar to Immigrants from Liberia are Immigrants from Middle Africa ($37,965, a difference of 0.010%), Delaware ($37,964, a difference of 0.010%), German ($37,986, a difference of 0.040%), Immigrants from Burma/Myanmar ($38,028, a difference of 0.15%), and Immigrants from Somalia ($37,914, a difference of 0.15%).
| Demographics | Rating | Rank | Median Female Earnings |
| Immigrants | Cabo Verde | 4.3 /100 | #237 | Tragic $38,208 |
| Alaska Natives | 4.3 /100 | #238 | Tragic $38,202 |
| English | 4.2 /100 | #239 | Tragic $38,196 |
| Finns | 4.0 /100 | #240 | Tragic $38,173 |
| Spanish | 3.5 /100 | #241 | Tragic $38,098 |
| Immigrants | Burma/Myanmar | 3.0 /100 | #242 | Tragic $38,028 |
| Germans | 2.8 /100 | #243 | Tragic $37,986 |
| Immigrants | Liberia | 2.7 /100 | #244 | Tragic $37,970 |
| Immigrants | Middle Africa | 2.7 /100 | #245 | Tragic $37,965 |
| Delaware | 2.6 /100 | #246 | Tragic $37,964 |
| Immigrants | Somalia | 2.4 /100 | #247 | Tragic $37,914 |
| Alaskan Athabascans | 2.3 /100 | #248 | Tragic $37,905 |
| Swiss | 2.3 /100 | #249 | Tragic $37,904 |
| Immigrants | Iraq | 2.2 /100 | #250 | Tragic $37,864 |
| Welsh | 2.1 /100 | #251 | Tragic $37,856 |