Chilean vs Immigrants from Central America Male Poverty
COMPARE
Chilean
Immigrants from Central America
Male Poverty
Male Poverty Comparison
Chileans
Immigrants from Central America
10.7%
MALE POVERTY
83.9/ 100
METRIC RATING
130th/ 347
METRIC RANK
13.9%
MALE POVERTY
0.0/ 100
METRIC RATING
295th/ 347
METRIC RANK
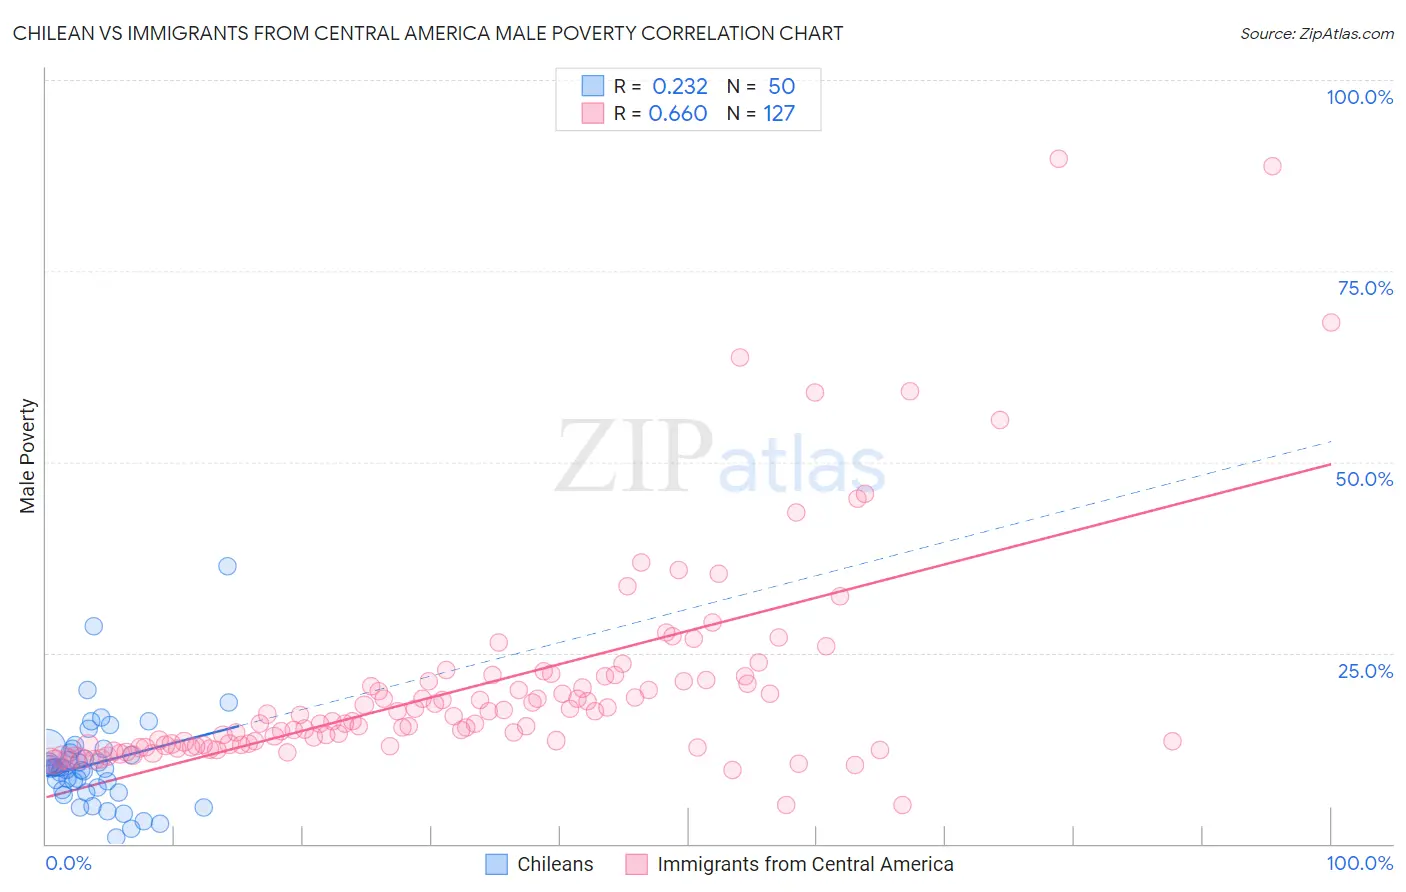
Chilean vs Immigrants from Central America Male Poverty Correlation Chart
The statistical analysis conducted on geographies consisting of 256,512,426 people shows a weak positive correlation between the proportion of Chileans and poverty level among males in the United States with a correlation coefficient (R) of 0.232 and weighted average of 10.7%. Similarly, the statistical analysis conducted on geographies consisting of 535,621,488 people shows a significant positive correlation between the proportion of Immigrants from Central America and poverty level among males in the United States with a correlation coefficient (R) of 0.660 and weighted average of 13.9%, a difference of 29.4%.
Male Poverty Correlation Summary
| Measurement | Chilean | Immigrants from Central America |
| Minimum | 0.80% | 5.0% |
| Maximum | 36.4% | 89.7% |
| Range | 35.6% | 84.7% |
| Mean | 10.5% | 20.6% |
| Median | 9.9% | 16.1% |
| Interquartile 25% (IQ1) | 7.0% | 12.9% |
| Interquartile 75% (IQ3) | 12.4% | 21.5% |
| Interquartile Range (IQR) | 5.3% | 8.5% |
| Standard Deviation (Sample) | 6.2% | 14.1% |
| Standard Deviation (Population) | 6.1% | 14.0% |
Similar Demographics by Male Poverty
Demographics Similar to Chileans by Male Poverty
In terms of male poverty, the demographic groups most similar to Chileans are Immigrants from Peru (10.7%, a difference of 0.050%), Immigrants from Western Europe (10.7%, a difference of 0.060%), Puget Sound Salish (10.7%, a difference of 0.070%), Immigrants from Ukraine (10.7%, a difference of 0.080%), and Immigrants from Belarus (10.7%, a difference of 0.11%).
| Demographics | Rating | Rank | Male Poverty |
| South Africans | 86.8 /100 | #123 | Excellent 10.7% |
| French | 86.7 /100 | #124 | Excellent 10.7% |
| Immigrants | Norway | 86.0 /100 | #125 | Excellent 10.7% |
| Immigrants | Ukraine | 84.3 /100 | #126 | Excellent 10.7% |
| Puget Sound Salish | 84.3 /100 | #127 | Excellent 10.7% |
| Immigrants | Western Europe | 84.2 /100 | #128 | Excellent 10.7% |
| Immigrants | Peru | 84.1 /100 | #129 | Excellent 10.7% |
| Chileans | 83.9 /100 | #130 | Excellent 10.7% |
| Immigrants | Belarus | 83.3 /100 | #131 | Excellent 10.7% |
| Immigrants | Vietnam | 83.0 /100 | #132 | Excellent 10.8% |
| Pakistanis | 83.0 /100 | #133 | Excellent 10.8% |
| New Zealanders | 82.9 /100 | #134 | Excellent 10.8% |
| Brazilians | 82.7 /100 | #135 | Excellent 10.8% |
| Immigrants | Israel | 80.9 /100 | #136 | Excellent 10.8% |
| Immigrants | Switzerland | 79.2 /100 | #137 | Good 10.8% |
Demographics Similar to Immigrants from Central America by Male Poverty
In terms of male poverty, the demographic groups most similar to Immigrants from Central America are Cajun (13.9%, a difference of 0.11%), Hispanic or Latino (13.9%, a difference of 0.28%), Immigrants from Belize (13.8%, a difference of 0.34%), Indonesian (13.8%, a difference of 0.35%), and Vietnamese (13.8%, a difference of 0.52%).
| Demographics | Rating | Rank | Male Poverty |
| Immigrants | St. Vincent and the Grenadines | 0.0 /100 | #288 | Tragic 13.8% |
| Guatemalans | 0.0 /100 | #289 | Tragic 13.8% |
| Immigrants | Zaire | 0.0 /100 | #290 | Tragic 13.8% |
| Vietnamese | 0.0 /100 | #291 | Tragic 13.8% |
| Indonesians | 0.0 /100 | #292 | Tragic 13.8% |
| Immigrants | Belize | 0.0 /100 | #293 | Tragic 13.8% |
| Hispanics or Latinos | 0.0 /100 | #294 | Tragic 13.9% |
| Immigrants | Central America | 0.0 /100 | #295 | Tragic 13.9% |
| Cajuns | 0.0 /100 | #296 | Tragic 13.9% |
| Inupiat | 0.0 /100 | #297 | Tragic 14.0% |
| Blackfeet | 0.0 /100 | #298 | Tragic 14.0% |
| Immigrants | Guatemala | 0.0 /100 | #299 | Tragic 14.0% |
| Immigrants | Mexico | 0.0 /100 | #300 | Tragic 14.0% |
| Immigrants | Senegal | 0.0 /100 | #301 | Tragic 14.0% |
| Immigrants | Caribbean | 0.0 /100 | #302 | Tragic 14.0% |