Immigrants from Kenya vs Immigrants from Central America Male Poverty
COMPARE
Immigrants from Kenya
Immigrants from Central America
Male Poverty
Male Poverty Comparison
Immigrants from Kenya
Immigrants from Central America
11.6%
MALE POVERTY
16.1/ 100
METRIC RATING
194th/ 347
METRIC RANK
13.9%
MALE POVERTY
0.0/ 100
METRIC RATING
295th/ 347
METRIC RANK
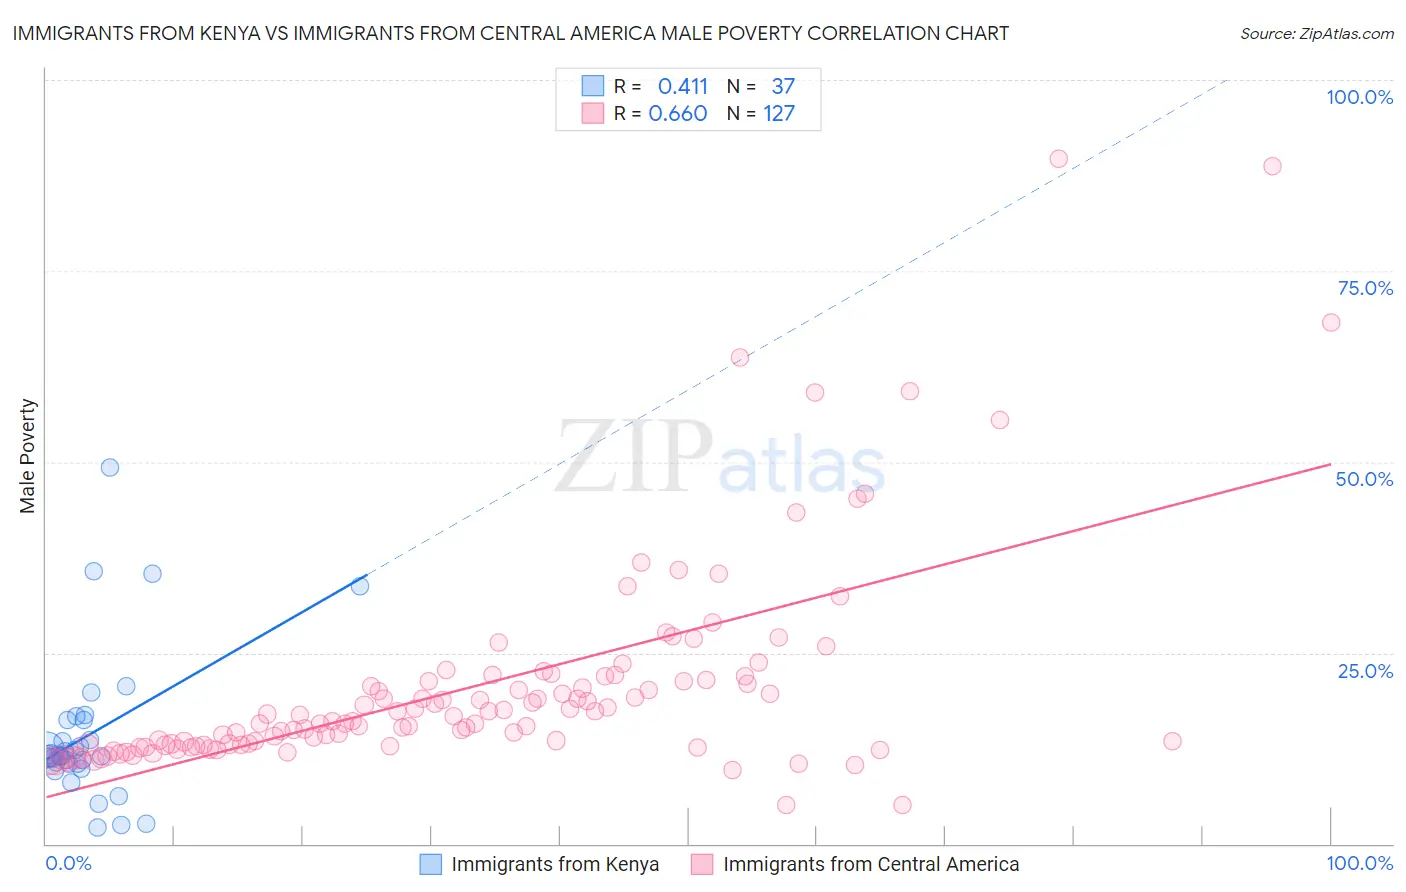
Immigrants from Kenya vs Immigrants from Central America Male Poverty Correlation Chart
The statistical analysis conducted on geographies consisting of 217,973,152 people shows a moderate positive correlation between the proportion of Immigrants from Kenya and poverty level among males in the United States with a correlation coefficient (R) of 0.411 and weighted average of 11.6%. Similarly, the statistical analysis conducted on geographies consisting of 535,621,488 people shows a significant positive correlation between the proportion of Immigrants from Central America and poverty level among males in the United States with a correlation coefficient (R) of 0.660 and weighted average of 13.9%, a difference of 19.4%.
Male Poverty Correlation Summary
| Measurement | Immigrants from Kenya | Immigrants from Central America |
| Minimum | 2.1% | 5.0% |
| Maximum | 49.2% | 89.7% |
| Range | 47.2% | 84.7% |
| Mean | 14.3% | 20.6% |
| Median | 11.5% | 16.1% |
| Interquartile 25% (IQ1) | 10.5% | 12.9% |
| Interquartile 75% (IQ3) | 16.2% | 21.5% |
| Interquartile Range (IQR) | 5.7% | 8.5% |
| Standard Deviation (Sample) | 9.7% | 14.1% |
| Standard Deviation (Population) | 9.6% | 14.0% |
Similar Demographics by Male Poverty
Demographics Similar to Immigrants from Kenya by Male Poverty
In terms of male poverty, the demographic groups most similar to Immigrants from Kenya are Arab (11.6%, a difference of 0.050%), Hmong (11.6%, a difference of 0.050%), Delaware (11.7%, a difference of 0.12%), Immigrants from Kuwait (11.6%, a difference of 0.21%), and Iraqi (11.7%, a difference of 0.25%).
| Demographics | Rating | Rank | Male Poverty |
| Immigrants | Iraq | 31.9 /100 | #187 | Fair 11.4% |
| Sierra Leoneans | 29.9 /100 | #188 | Fair 11.4% |
| Hawaiians | 28.3 /100 | #189 | Fair 11.4% |
| Israelis | 26.1 /100 | #190 | Fair 11.5% |
| South American Indians | 22.8 /100 | #191 | Fair 11.5% |
| Immigrants | Uruguay | 19.1 /100 | #192 | Poor 11.6% |
| Immigrants | Kuwait | 17.3 /100 | #193 | Poor 11.6% |
| Immigrants | Kenya | 16.1 /100 | #194 | Poor 11.6% |
| Arabs | 15.8 /100 | #195 | Poor 11.6% |
| Hmong | 15.8 /100 | #196 | Poor 11.6% |
| Delaware | 15.4 /100 | #197 | Poor 11.7% |
| Iraqis | 14.7 /100 | #198 | Poor 11.7% |
| Spanish | 14.1 /100 | #199 | Poor 11.7% |
| Immigrants | Lebanon | 13.6 /100 | #200 | Poor 11.7% |
| Spaniards | 13.5 /100 | #201 | Poor 11.7% |
Demographics Similar to Immigrants from Central America by Male Poverty
In terms of male poverty, the demographic groups most similar to Immigrants from Central America are Cajun (13.9%, a difference of 0.11%), Hispanic or Latino (13.9%, a difference of 0.28%), Immigrants from Belize (13.8%, a difference of 0.34%), Indonesian (13.8%, a difference of 0.35%), and Vietnamese (13.8%, a difference of 0.52%).
| Demographics | Rating | Rank | Male Poverty |
| Immigrants | St. Vincent and the Grenadines | 0.0 /100 | #288 | Tragic 13.8% |
| Guatemalans | 0.0 /100 | #289 | Tragic 13.8% |
| Immigrants | Zaire | 0.0 /100 | #290 | Tragic 13.8% |
| Vietnamese | 0.0 /100 | #291 | Tragic 13.8% |
| Indonesians | 0.0 /100 | #292 | Tragic 13.8% |
| Immigrants | Belize | 0.0 /100 | #293 | Tragic 13.8% |
| Hispanics or Latinos | 0.0 /100 | #294 | Tragic 13.9% |
| Immigrants | Central America | 0.0 /100 | #295 | Tragic 13.9% |
| Cajuns | 0.0 /100 | #296 | Tragic 13.9% |
| Inupiat | 0.0 /100 | #297 | Tragic 14.0% |
| Blackfeet | 0.0 /100 | #298 | Tragic 14.0% |
| Immigrants | Guatemala | 0.0 /100 | #299 | Tragic 14.0% |
| Immigrants | Mexico | 0.0 /100 | #300 | Tragic 14.0% |
| Immigrants | Senegal | 0.0 /100 | #301 | Tragic 14.0% |
| Immigrants | Caribbean | 0.0 /100 | #302 | Tragic 14.0% |