Puerto Rican vs Guamanian/Chamorro Seniors Poverty Over the Age of 65
COMPARE
Puerto Rican
Guamanian/Chamorro
Seniors Poverty Over the Age of 65
Seniors Poverty Over the Age of 65 Comparison
Puerto Ricans
Guamanians/Chamorros
21.4%
SENIORS POVERTY OVER THE AGE OF 65
0.0/ 100
METRIC RATING
347th/ 347
METRIC RANK
10.5%
SENIORS POVERTY OVER THE AGE OF 65
87.5/ 100
METRIC RATING
133rd/ 347
METRIC RANK
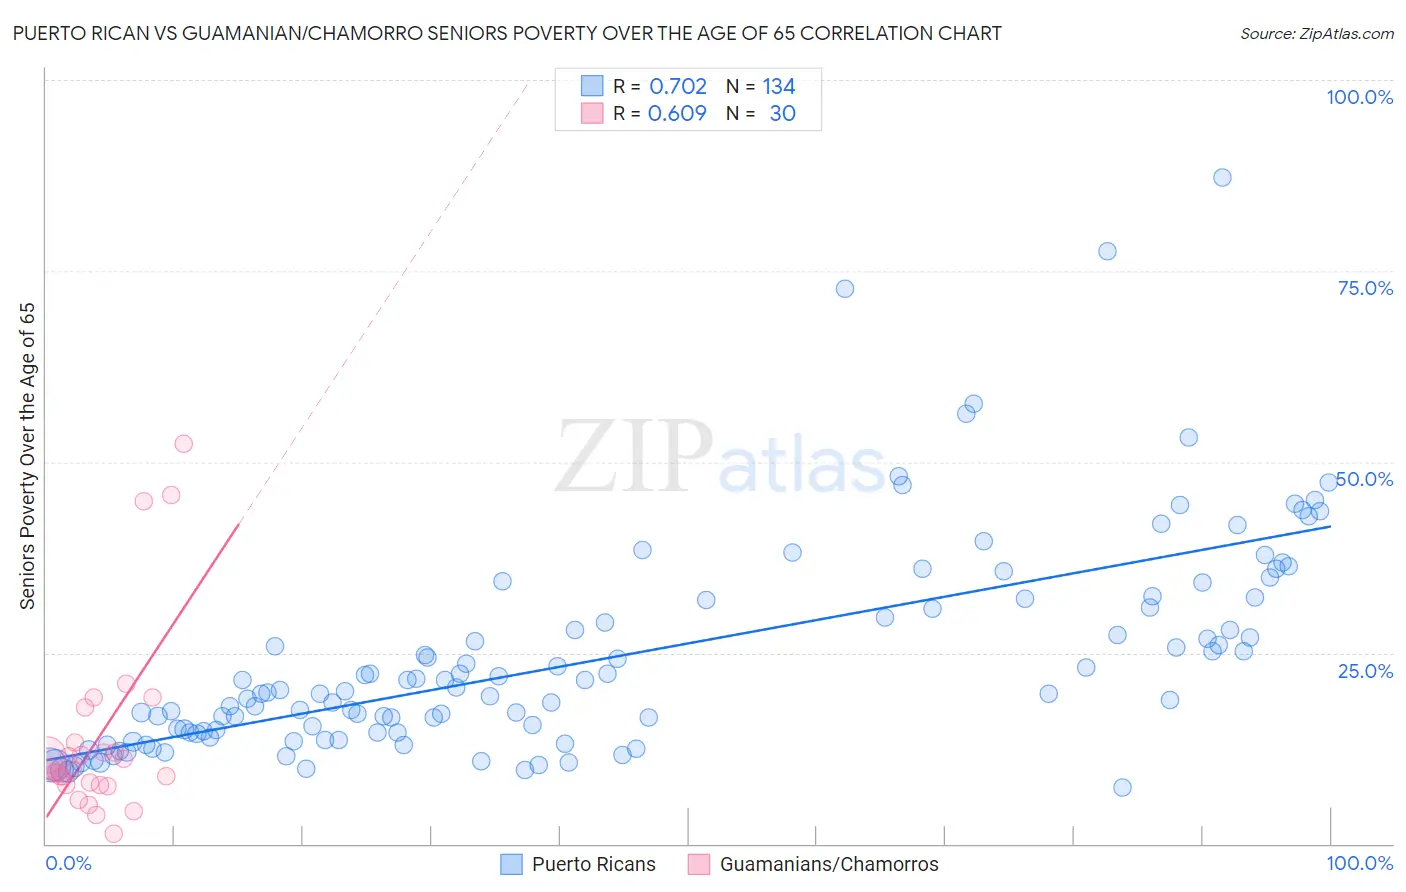
Puerto Rican vs Guamanian/Chamorro Seniors Poverty Over the Age of 65 Correlation Chart
The statistical analysis conducted on geographies consisting of 524,803,283 people shows a strong positive correlation between the proportion of Puerto Ricans and poverty level among seniors over the age of 65 in the United States with a correlation coefficient (R) of 0.702 and weighted average of 21.4%. Similarly, the statistical analysis conducted on geographies consisting of 221,115,754 people shows a significant positive correlation between the proportion of Guamanians/Chamorros and poverty level among seniors over the age of 65 in the United States with a correlation coefficient (R) of 0.609 and weighted average of 10.5%, a difference of 104.6%.
Seniors Poverty Over the Age of 65 Correlation Summary
| Measurement | Puerto Rican | Guamanian/Chamorro |
| Minimum | 7.4% | 1.2% |
| Maximum | 87.3% | 52.4% |
| Range | 79.9% | 51.1% |
| Mean | 24.3% | 13.9% |
| Median | 19.9% | 9.7% |
| Interquartile 25% (IQ1) | 14.5% | 7.7% |
| Interquartile 75% (IQ3) | 30.9% | 13.2% |
| Interquartile Range (IQR) | 16.3% | 5.5% |
| Standard Deviation (Sample) | 14.1% | 12.3% |
| Standard Deviation (Population) | 14.0% | 12.1% |
Similar Demographics by Seniors Poverty Over the Age of 65
Demographics Similar to Puerto Ricans by Seniors Poverty Over the Age of 65
In terms of seniors poverty over the age of 65, the demographic groups most similar to Puerto Ricans are Tohono O'odham (20.8%, a difference of 2.7%), Pima (19.8%, a difference of 8.1%), Immigrants from Dominican Republic (18.3%, a difference of 17.0%), Lumbee (18.1%, a difference of 18.1%), and Immigrants from Cuba (17.9%, a difference of 19.4%).
| Demographics | Rating | Rank | Seniors Poverty Over the Age of 65 |
| Immigrants | Yemen | 0.0 /100 | #333 | Tragic 15.9% |
| Immigrants | Nicaragua | 0.0 /100 | #334 | Tragic 15.9% |
| Cubans | 0.0 /100 | #335 | Tragic 16.1% |
| Immigrants | Cabo Verde | 0.0 /100 | #336 | Tragic 16.2% |
| Immigrants | Caribbean | 0.0 /100 | #337 | Tragic 16.5% |
| Pueblo | 0.0 /100 | #338 | Tragic 17.2% |
| Navajo | 0.0 /100 | #339 | Tragic 17.5% |
| Hopi | 0.0 /100 | #340 | Tragic 17.8% |
| Dominicans | 0.0 /100 | #341 | Tragic 17.8% |
| Immigrants | Cuba | 0.0 /100 | #342 | Tragic 17.9% |
| Lumbee | 0.0 /100 | #343 | Tragic 18.1% |
| Immigrants | Dominican Republic | 0.0 /100 | #344 | Tragic 18.3% |
| Pima | 0.0 /100 | #345 | Tragic 19.8% |
| Tohono O'odham | 0.0 /100 | #346 | Tragic 20.8% |
| Puerto Ricans | 0.0 /100 | #347 | Tragic 21.4% |
Demographics Similar to Guamanians/Chamorros by Seniors Poverty Over the Age of 65
In terms of seniors poverty over the age of 65, the demographic groups most similar to Guamanians/Chamorros are Immigrants from Turkey (10.5%, a difference of 0.040%), Egyptian (10.5%, a difference of 0.050%), Sierra Leonean (10.5%, a difference of 0.15%), Immigrants from Iran (10.4%, a difference of 0.20%), and Immigrants from Oceania (10.4%, a difference of 0.20%).
| Demographics | Rating | Rank | Seniors Poverty Over the Age of 65 |
| Immigrants | Hungary | 89.1 /100 | #126 | Excellent 10.4% |
| Cambodians | 89.1 /100 | #127 | Excellent 10.4% |
| Ottawa | 88.5 /100 | #128 | Excellent 10.4% |
| Immigrants | Iran | 88.4 /100 | #129 | Excellent 10.4% |
| Immigrants | Oceania | 88.4 /100 | #130 | Excellent 10.4% |
| Egyptians | 87.8 /100 | #131 | Excellent 10.5% |
| Immigrants | Turkey | 87.7 /100 | #132 | Excellent 10.5% |
| Guamanians/Chamorros | 87.5 /100 | #133 | Excellent 10.5% |
| Sierra Leoneans | 86.8 /100 | #134 | Excellent 10.5% |
| Immigrants | Norway | 86.5 /100 | #135 | Excellent 10.5% |
| Immigrants | Serbia | 86.4 /100 | #136 | Excellent 10.5% |
| Immigrants | Australia | 85.1 /100 | #137 | Excellent 10.5% |
| Immigrants | Latvia | 84.7 /100 | #138 | Excellent 10.5% |
| Portuguese | 84.1 /100 | #139 | Excellent 10.5% |
| Immigrants | Kenya | 83.4 /100 | #140 | Excellent 10.5% |