Immigrants from Latin America vs Iroquois Single Male Poverty
COMPARE
Immigrants from Latin America
Iroquois
Single Male Poverty
Single Male Poverty Comparison
Immigrants from Latin America
Iroquois
13.5%
SINGLE MALE POVERTY
1.3/ 100
METRIC RATING
245th/ 347
METRIC RANK
14.5%
SINGLE MALE POVERTY
0.0/ 100
METRIC RATING
287th/ 347
METRIC RANK
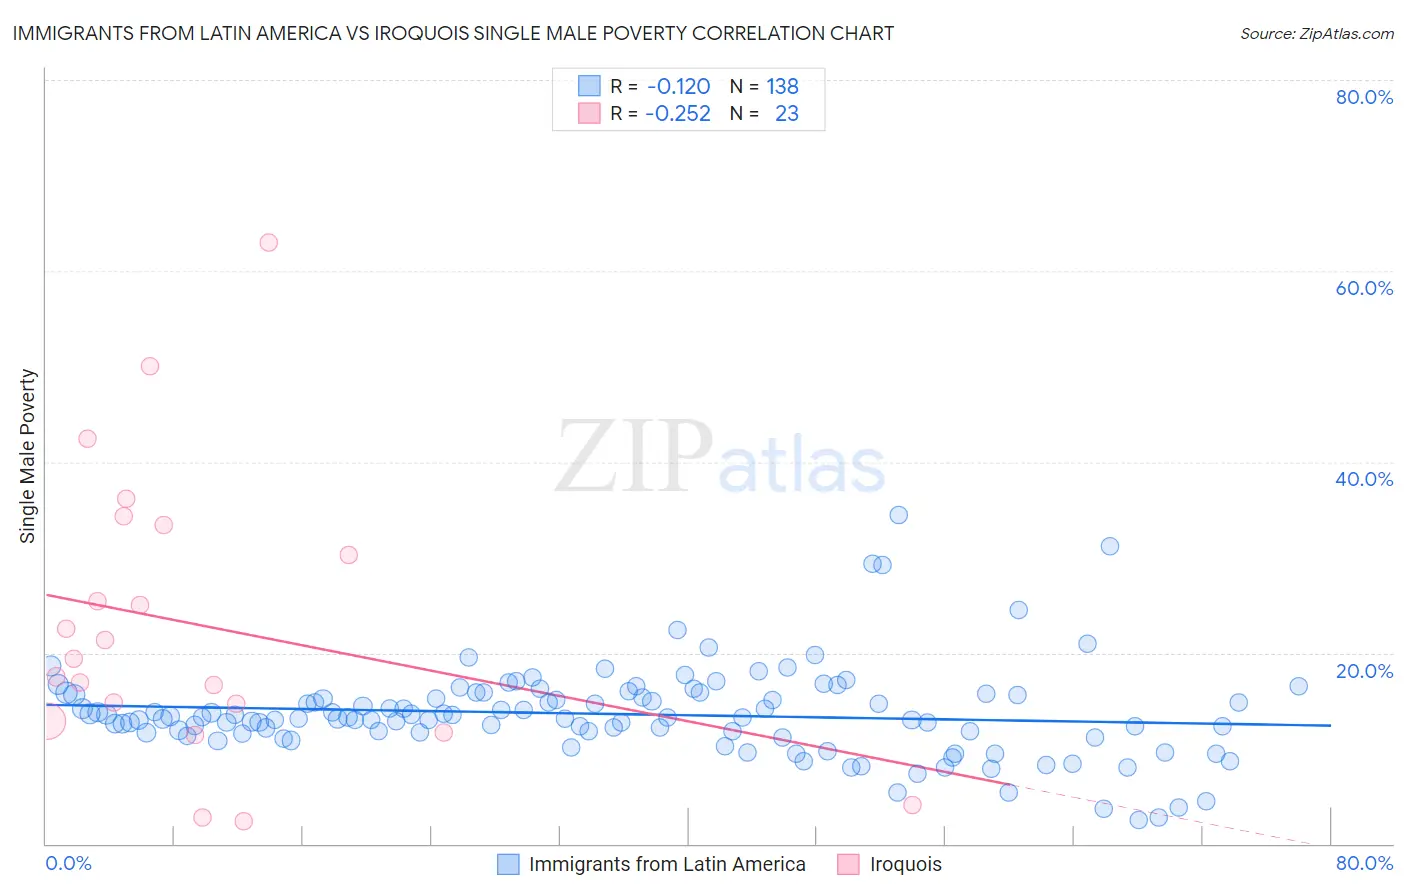
Immigrants from Latin America vs Iroquois Single Male Poverty Correlation Chart
The statistical analysis conducted on geographies consisting of 467,663,456 people shows a poor negative correlation between the proportion of Immigrants from Latin America and poverty level among single males in the United States with a correlation coefficient (R) of -0.120 and weighted average of 13.5%. Similarly, the statistical analysis conducted on geographies consisting of 192,366,104 people shows a weak negative correlation between the proportion of Iroquois and poverty level among single males in the United States with a correlation coefficient (R) of -0.252 and weighted average of 14.5%, a difference of 7.1%.
Single Male Poverty Correlation Summary
| Measurement | Immigrants from Latin America | Iroquois |
| Minimum | 2.4% | 2.4% |
| Maximum | 34.5% | 63.0% |
| Range | 32.0% | 60.6% |
| Mean | 13.6% | 23.0% |
| Median | 13.2% | 19.4% |
| Interquartile 25% (IQ1) | 11.6% | 12.8% |
| Interquartile 75% (IQ3) | 15.6% | 33.3% |
| Interquartile Range (IQR) | 4.1% | 20.5% |
| Standard Deviation (Sample) | 4.8% | 15.1% |
| Standard Deviation (Population) | 4.8% | 14.7% |
Similar Demographics by Single Male Poverty
Demographics Similar to Immigrants from Latin America by Single Male Poverty
In terms of single male poverty, the demographic groups most similar to Immigrants from Latin America are Immigrants from Micronesia (13.5%, a difference of 0.10%), Belgian (13.5%, a difference of 0.12%), Czech (13.5%, a difference of 0.14%), Immigrants from Senegal (13.5%, a difference of 0.26%), and Spanish (13.6%, a difference of 0.38%).
| Demographics | Rating | Rank | Single Male Poverty |
| Immigrants | Ghana | 3.2 /100 | #238 | Tragic 13.4% |
| Czechoslovakians | 3.0 /100 | #239 | Tragic 13.4% |
| Belizeans | 2.3 /100 | #240 | Tragic 13.4% |
| Immigrants | Germany | 2.1 /100 | #241 | Tragic 13.4% |
| Carpatho Rusyns | 2.1 /100 | #242 | Tragic 13.4% |
| Barbadians | 2.1 /100 | #243 | Tragic 13.4% |
| Immigrants | Senegal | 1.7 /100 | #244 | Tragic 13.5% |
| Immigrants | Latin America | 1.3 /100 | #245 | Tragic 13.5% |
| Immigrants | Micronesia | 1.2 /100 | #246 | Tragic 13.5% |
| Belgians | 1.2 /100 | #247 | Tragic 13.5% |
| Czechs | 1.2 /100 | #248 | Tragic 13.5% |
| Spanish | 1.0 /100 | #249 | Tragic 13.6% |
| Immigrants | Somalia | 1.0 /100 | #250 | Tragic 13.6% |
| Immigrants | Zaire | 0.9 /100 | #251 | Tragic 13.6% |
| Finns | 0.9 /100 | #252 | Tragic 13.6% |
Demographics Similar to Iroquois by Single Male Poverty
In terms of single male poverty, the demographic groups most similar to Iroquois are White/Caucasian (14.5%, a difference of 0.0%), Immigrants from Dominica (14.5%, a difference of 0.090%), Celtic (14.5%, a difference of 0.13%), U.S. Virgin Islander (14.5%, a difference of 0.32%), and French (14.4%, a difference of 0.45%).
| Demographics | Rating | Rank | Single Male Poverty |
| Hmong | 0.0 /100 | #280 | Tragic 14.2% |
| Hispanics or Latinos | 0.0 /100 | #281 | Tragic 14.2% |
| Spanish Americans | 0.0 /100 | #282 | Tragic 14.2% |
| Yaqui | 0.0 /100 | #283 | Tragic 14.2% |
| Immigrants | Bahamas | 0.0 /100 | #284 | Tragic 14.4% |
| French | 0.0 /100 | #285 | Tragic 14.4% |
| Celtics | 0.0 /100 | #286 | Tragic 14.5% |
| Iroquois | 0.0 /100 | #287 | Tragic 14.5% |
| Whites/Caucasians | 0.0 /100 | #288 | Tragic 14.5% |
| Immigrants | Dominica | 0.0 /100 | #289 | Tragic 14.5% |
| U.S. Virgin Islanders | 0.0 /100 | #290 | Tragic 14.5% |
| Bahamians | 0.0 /100 | #291 | Tragic 14.6% |
| Immigrants | Nonimmigrants | 0.0 /100 | #292 | Tragic 14.6% |
| French Canadians | 0.0 /100 | #293 | Tragic 14.6% |
| Ottawa | 0.0 /100 | #294 | Tragic 14.6% |