Iraqi vs Yuman Single Father Poverty
COMPARE
Iraqi
Yuman
Single Father Poverty
Single Father Poverty Comparison
Iraqis
Yuman
15.9%
SINGLE FATHER POVERTY
91.2/ 100
METRIC RATING
125th/ 347
METRIC RANK
28.4%
SINGLE FATHER POVERTY
0.0/ 100
METRIC RATING
342nd/ 347
METRIC RANK
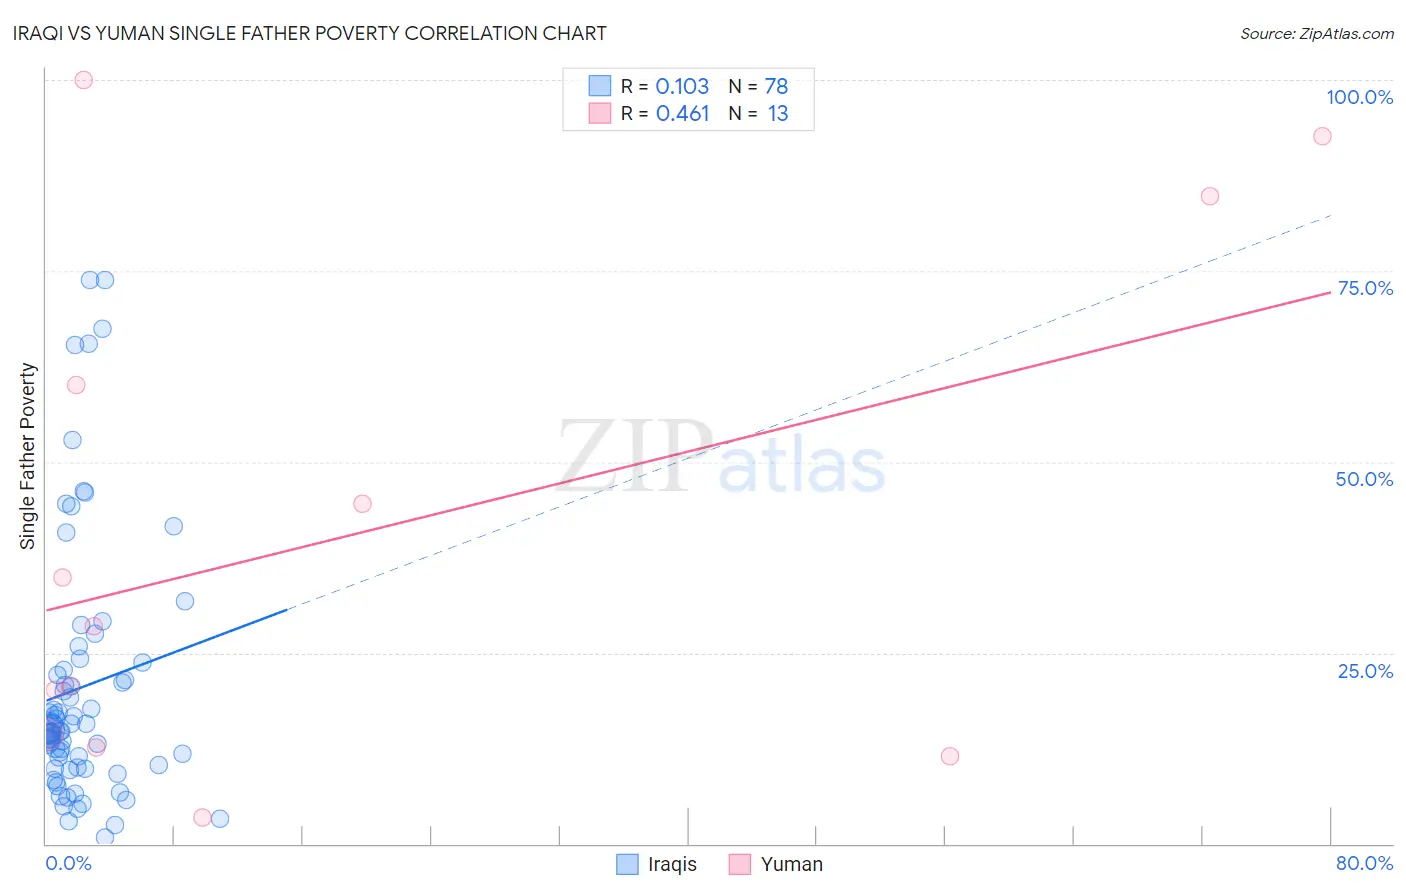
Iraqi vs Yuman Single Father Poverty Correlation Chart
The statistical analysis conducted on geographies consisting of 147,926,466 people shows a poor positive correlation between the proportion of Iraqis and poverty level among single fathers in the United States with a correlation coefficient (R) of 0.103 and weighted average of 15.9%. Similarly, the statistical analysis conducted on geographies consisting of 39,127,530 people shows a moderate positive correlation between the proportion of Yuman and poverty level among single fathers in the United States with a correlation coefficient (R) of 0.461 and weighted average of 28.4%, a difference of 78.8%.
Single Father Poverty Correlation Summary
| Measurement | Iraqi | Yuman |
| Minimum | 0.90% | 3.4% |
| Maximum | 73.8% | 100.0% |
| Range | 72.9% | 96.6% |
| Mean | 20.5% | 40.6% |
| Median | 14.9% | 28.5% |
| Interquartile 25% (IQ1) | 10.0% | 13.4% |
| Interquartile 75% (IQ3) | 22.7% | 72.4% |
| Interquartile Range (IQR) | 12.8% | 58.9% |
| Standard Deviation (Sample) | 16.9% | 33.3% |
| Standard Deviation (Population) | 16.8% | 32.0% |
Similar Demographics by Single Father Poverty
Demographics Similar to Iraqis by Single Father Poverty
In terms of single father poverty, the demographic groups most similar to Iraqis are Immigrants from Panama (15.9%, a difference of 0.010%), Hmong (15.9%, a difference of 0.010%), Palestinian (15.9%, a difference of 0.020%), Immigrants from Liberia (15.9%, a difference of 0.020%), and Sudanese (15.9%, a difference of 0.050%).
| Demographics | Rating | Rank | Single Father Poverty |
| Immigrants | Eastern Europe | 92.5 /100 | #118 | Exceptional 15.8% |
| Immigrants | Belarus | 92.4 /100 | #119 | Exceptional 15.8% |
| Uruguayans | 92.1 /100 | #120 | Exceptional 15.9% |
| Immigrants | Immigrants | 91.9 /100 | #121 | Exceptional 15.9% |
| Sudanese | 91.6 /100 | #122 | Exceptional 15.9% |
| Palestinians | 91.3 /100 | #123 | Exceptional 15.9% |
| Immigrants | Panama | 91.3 /100 | #124 | Exceptional 15.9% |
| Iraqis | 91.2 /100 | #125 | Exceptional 15.9% |
| Hmong | 91.1 /100 | #126 | Exceptional 15.9% |
| Immigrants | Liberia | 91.1 /100 | #127 | Exceptional 15.9% |
| Immigrants | Nigeria | 90.8 /100 | #128 | Exceptional 15.9% |
| Immigrants | West Indies | 90.8 /100 | #129 | Exceptional 15.9% |
| Norwegians | 90.2 /100 | #130 | Exceptional 15.9% |
| Nicaraguans | 90.1 /100 | #131 | Exceptional 15.9% |
| Immigrants | Portugal | 89.7 /100 | #132 | Excellent 15.9% |
Demographics Similar to Yuman by Single Father Poverty
In terms of single father poverty, the demographic groups most similar to Yuman are Lumbee (28.5%, a difference of 0.33%), Navajo (29.2%, a difference of 2.9%), Hopi (27.2%, a difference of 4.5%), Houma (26.7%, a difference of 6.2%), and Crow (30.3%, a difference of 6.7%).
| Demographics | Rating | Rank | Single Father Poverty |
| Natives/Alaskans | 0.0 /100 | #333 | Tragic 22.4% |
| Kiowa | 0.0 /100 | #334 | Tragic 22.5% |
| Shoshone | 0.0 /100 | #335 | Tragic 22.9% |
| Cajuns | 0.0 /100 | #336 | Tragic 23.1% |
| Sioux | 0.0 /100 | #337 | Tragic 23.9% |
| Arapaho | 0.0 /100 | #338 | Tragic 24.0% |
| Apache | 0.0 /100 | #339 | Tragic 24.2% |
| Houma | 0.0 /100 | #340 | Tragic 26.7% |
| Hopi | 0.0 /100 | #341 | Tragic 27.2% |
| Yuman | 0.0 /100 | #342 | Tragic 28.4% |
| Lumbee | 0.0 /100 | #343 | Tragic 28.5% |
| Navajo | 0.0 /100 | #344 | Tragic 29.2% |
| Crow | 0.0 /100 | #345 | Tragic 30.3% |
| Puerto Ricans | 0.0 /100 | #346 | Tragic 31.5% |
| Yup'ik | 0.0 /100 | #347 | Tragic 32.5% |