Cheyenne vs Immigrants from Mexico Family Poverty
COMPARE
Cheyenne
Immigrants from Mexico
Family Poverty
Family Poverty Comparison
Cheyenne
Immigrants from Mexico
14.3%
FAMILY POVERTY
0.0/ 100
METRIC RATING
331st/ 347
METRIC RANK
12.3%
FAMILY POVERTY
0.0/ 100
METRIC RATING
315th/ 347
METRIC RANK
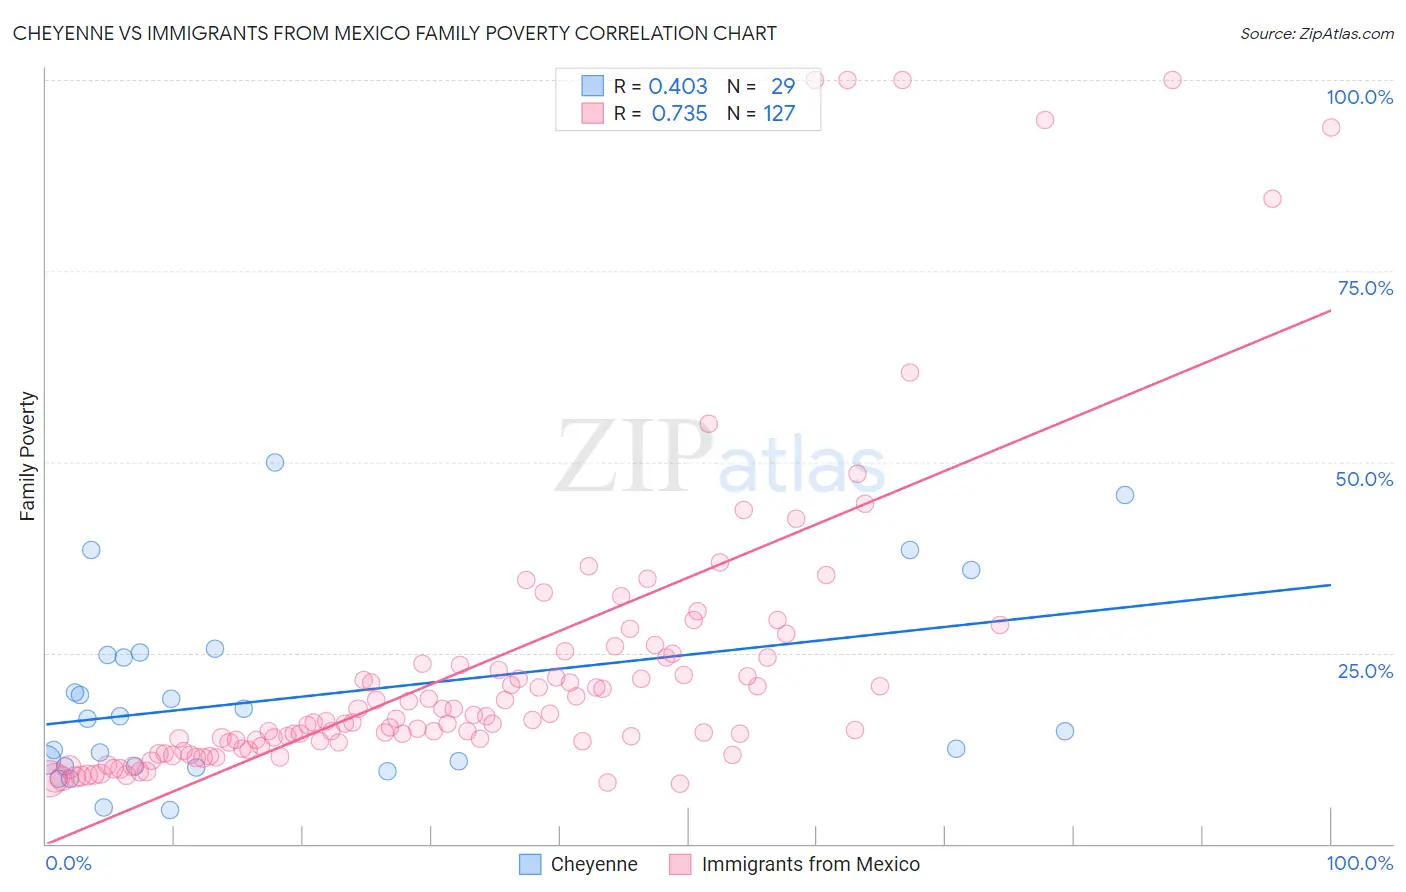
Cheyenne vs Immigrants from Mexico Family Poverty Correlation Chart
The statistical analysis conducted on geographies consisting of 80,652,371 people shows a moderate positive correlation between the proportion of Cheyenne and poverty level among families in the United States with a correlation coefficient (R) of 0.403 and weighted average of 14.3%. Similarly, the statistical analysis conducted on geographies consisting of 511,802,824 people shows a strong positive correlation between the proportion of Immigrants from Mexico and poverty level among families in the United States with a correlation coefficient (R) of 0.735 and weighted average of 12.3%, a difference of 16.3%.
Family Poverty Correlation Summary
| Measurement | Cheyenne | Immigrants from Mexico |
| Minimum | 4.4% | 7.9% |
| Maximum | 50.0% | 100.0% |
| Range | 45.6% | 92.1% |
| Mean | 19.2% | 23.1% |
| Median | 16.4% | 15.9% |
| Interquartile 25% (IQ1) | 10.1% | 12.5% |
| Interquartile 75% (IQ3) | 24.9% | 24.4% |
| Interquartile Range (IQR) | 14.7% | 11.9% |
| Standard Deviation (Sample) | 12.1% | 20.2% |
| Standard Deviation (Population) | 11.9% | 20.1% |
Demographics Similar to Cheyenne and Immigrants from Mexico by Family Poverty
In terms of family poverty, the demographic groups most similar to Cheyenne are Native/Alaskan (14.3%, a difference of 0.14%), Dominican (14.3%, a difference of 0.44%), Immigrants from Dominican Republic (14.4%, a difference of 1.1%), Black/African American (13.3%, a difference of 7.1%), and Central American Indian (13.3%, a difference of 7.3%). Similarly, the demographic groups most similar to Immigrants from Mexico are Kiowa (12.2%, a difference of 0.26%), Honduran (12.4%, a difference of 0.74%), Immigrants from Caribbean (12.2%, a difference of 0.76%), Immigrants from Grenada (12.4%, a difference of 0.96%), and U.S. Virgin Islander (12.4%, a difference of 0.96%).
| Demographics | Rating | Rank | Family Poverty |
| Immigrants | Caribbean | 0.0 /100 | #313 | Tragic 12.2% |
| Kiowa | 0.0 /100 | #314 | Tragic 12.2% |
| Immigrants | Mexico | 0.0 /100 | #315 | Tragic 12.3% |
| Hondurans | 0.0 /100 | #316 | Tragic 12.4% |
| Immigrants | Grenada | 0.0 /100 | #317 | Tragic 12.4% |
| U.S. Virgin Islanders | 0.0 /100 | #318 | Tragic 12.4% |
| British West Indians | 0.0 /100 | #319 | Tragic 12.4% |
| Inupiat | 0.0 /100 | #320 | Tragic 12.5% |
| Arapaho | 0.0 /100 | #321 | Tragic 12.7% |
| Immigrants | Honduras | 0.0 /100 | #322 | Tragic 12.7% |
| Menominee | 0.0 /100 | #323 | Tragic 12.7% |
| Immigrants | Dominica | 0.0 /100 | #324 | Tragic 12.7% |
| Paiute | 0.0 /100 | #325 | Tragic 13.0% |
| Colville | 0.0 /100 | #326 | Tragic 13.0% |
| Yakama | 0.0 /100 | #327 | Tragic 13.1% |
| Central American Indians | 0.0 /100 | #328 | Tragic 13.3% |
| Blacks/African Americans | 0.0 /100 | #329 | Tragic 13.3% |
| Natives/Alaskans | 0.0 /100 | #330 | Tragic 14.3% |
| Cheyenne | 0.0 /100 | #331 | Tragic 14.3% |
| Dominicans | 0.0 /100 | #332 | Tragic 14.3% |
| Immigrants | Dominican Republic | 0.0 /100 | #333 | Tragic 14.4% |