Nigerian vs Immigrants from Mexico Family Poverty
COMPARE
Nigerian
Immigrants from Mexico
Family Poverty
Family Poverty Comparison
Nigerians
Immigrants from Mexico
10.1%
FAMILY POVERTY
2.0/ 100
METRIC RATING
235th/ 347
METRIC RANK
12.3%
FAMILY POVERTY
0.0/ 100
METRIC RATING
315th/ 347
METRIC RANK
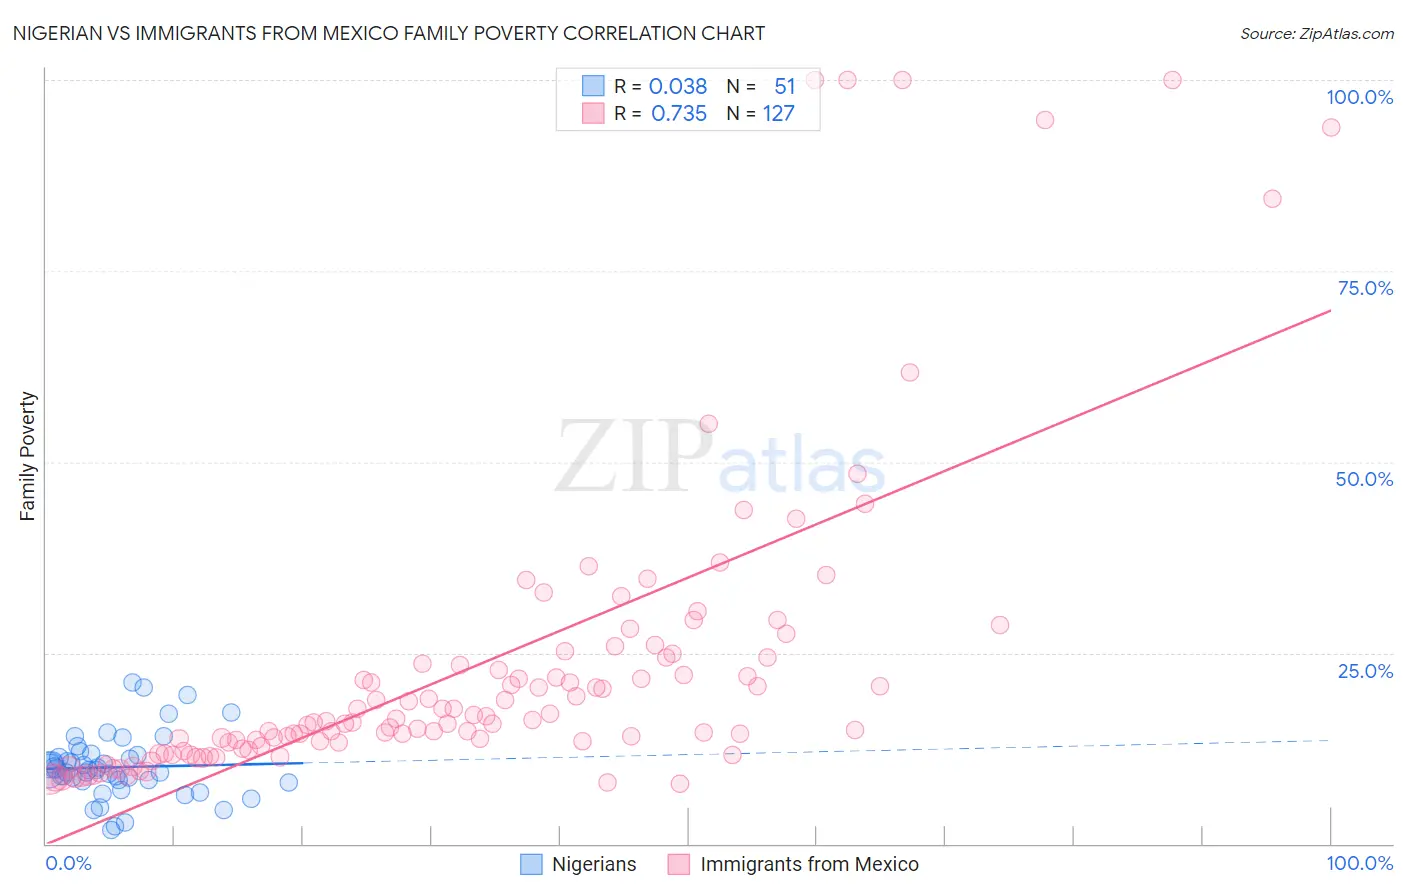
Nigerian vs Immigrants from Mexico Family Poverty Correlation Chart
The statistical analysis conducted on geographies consisting of 332,122,343 people shows no correlation between the proportion of Nigerians and poverty level among families in the United States with a correlation coefficient (R) of 0.038 and weighted average of 10.1%. Similarly, the statistical analysis conducted on geographies consisting of 511,802,824 people shows a strong positive correlation between the proportion of Immigrants from Mexico and poverty level among families in the United States with a correlation coefficient (R) of 0.735 and weighted average of 12.3%, a difference of 21.0%.
Family Poverty Correlation Summary
| Measurement | Nigerian | Immigrants from Mexico |
| Minimum | 1.9% | 7.9% |
| Maximum | 21.1% | 100.0% |
| Range | 19.2% | 92.1% |
| Mean | 10.0% | 23.1% |
| Median | 9.6% | 15.9% |
| Interquartile 25% (IQ1) | 8.3% | 12.5% |
| Interquartile 75% (IQ3) | 11.6% | 24.4% |
| Interquartile Range (IQR) | 3.4% | 11.9% |
| Standard Deviation (Sample) | 4.2% | 20.2% |
| Standard Deviation (Population) | 4.1% | 20.1% |
Similar Demographics by Family Poverty
Demographics Similar to Nigerians by Family Poverty
In terms of family poverty, the demographic groups most similar to Nigerians are Immigrants from Middle Africa (10.1%, a difference of 0.030%), Fijian (10.1%, a difference of 0.14%), Immigrants from Nigeria (10.2%, a difference of 0.25%), Immigrants from Sudan (10.1%, a difference of 0.39%), and Immigrants from Laos (10.2%, a difference of 0.51%).
| Demographics | Rating | Rank | Family Poverty |
| Sudanese | 3.1 /100 | #228 | Tragic 10.0% |
| Immigrants | Uzbekistan | 3.1 /100 | #229 | Tragic 10.0% |
| Immigrants | Panama | 3.1 /100 | #230 | Tragic 10.0% |
| Alaskan Athabascans | 2.7 /100 | #231 | Tragic 10.1% |
| Immigrants | Sudan | 2.3 /100 | #232 | Tragic 10.1% |
| Fijians | 2.1 /100 | #233 | Tragic 10.1% |
| Immigrants | Middle Africa | 2.1 /100 | #234 | Tragic 10.1% |
| Nigerians | 2.0 /100 | #235 | Tragic 10.1% |
| Immigrants | Nigeria | 1.9 /100 | #236 | Tragic 10.2% |
| Immigrants | Laos | 1.7 /100 | #237 | Tragic 10.2% |
| French American Indians | 1.5 /100 | #238 | Tragic 10.2% |
| Potawatomi | 1.5 /100 | #239 | Tragic 10.2% |
| Immigrants | Azores | 1.4 /100 | #240 | Tragic 10.3% |
| Ghanaians | 1.3 /100 | #241 | Tragic 10.3% |
| Alaska Natives | 1.0 /100 | #242 | Tragic 10.4% |
Demographics Similar to Immigrants from Mexico by Family Poverty
In terms of family poverty, the demographic groups most similar to Immigrants from Mexico are Kiowa (12.2%, a difference of 0.26%), Honduran (12.4%, a difference of 0.74%), Immigrants from Caribbean (12.2%, a difference of 0.76%), Immigrants from Grenada (12.4%, a difference of 0.96%), and U.S. Virgin Islander (12.4%, a difference of 0.96%).
| Demographics | Rating | Rank | Family Poverty |
| Seminole | 0.0 /100 | #308 | Tragic 11.9% |
| Hispanics or Latinos | 0.0 /100 | #309 | Tragic 12.0% |
| Immigrants | Guatemala | 0.0 /100 | #310 | Tragic 12.0% |
| Ute | 0.0 /100 | #311 | Tragic 12.1% |
| Immigrants | Central America | 0.0 /100 | #312 | Tragic 12.1% |
| Immigrants | Caribbean | 0.0 /100 | #313 | Tragic 12.2% |
| Kiowa | 0.0 /100 | #314 | Tragic 12.2% |
| Immigrants | Mexico | 0.0 /100 | #315 | Tragic 12.3% |
| Hondurans | 0.0 /100 | #316 | Tragic 12.4% |
| Immigrants | Grenada | 0.0 /100 | #317 | Tragic 12.4% |
| U.S. Virgin Islanders | 0.0 /100 | #318 | Tragic 12.4% |
| British West Indians | 0.0 /100 | #319 | Tragic 12.4% |
| Inupiat | 0.0 /100 | #320 | Tragic 12.5% |
| Arapaho | 0.0 /100 | #321 | Tragic 12.7% |
| Immigrants | Honduras | 0.0 /100 | #322 | Tragic 12.7% |