Polish vs Latvian Family Poverty
COMPARE
Polish
Latvian
Family Poverty
Family Poverty Comparison
Poles
Latvians
7.4%
FAMILY POVERTY
99.5/ 100
METRIC RATING
32nd/ 347
METRIC RANK
7.1%
FAMILY POVERTY
99.9/ 100
METRIC RATING
9th/ 347
METRIC RANK
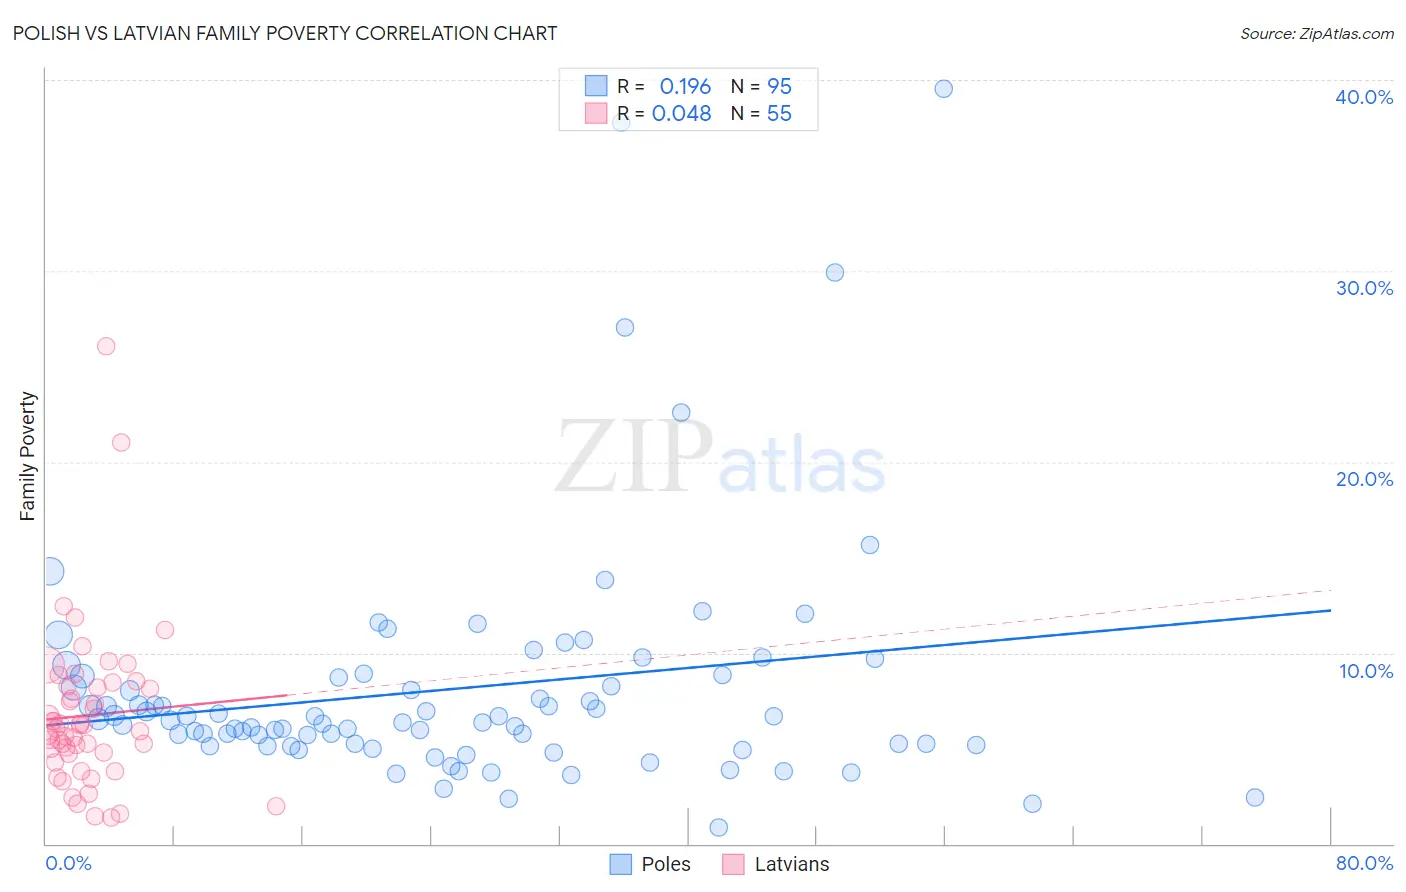
Polish vs Latvian Family Poverty Correlation Chart
The statistical analysis conducted on geographies consisting of 555,842,099 people shows a poor positive correlation between the proportion of Poles and poverty level among families in the United States with a correlation coefficient (R) of 0.196 and weighted average of 7.4%. Similarly, the statistical analysis conducted on geographies consisting of 220,290,550 people shows no correlation between the proportion of Latvians and poverty level among families in the United States with a correlation coefficient (R) of 0.048 and weighted average of 7.1%, a difference of 5.0%.
Family Poverty Correlation Summary
| Measurement | Polish | Latvian |
| Minimum | 0.85% | 1.4% |
| Maximum | 39.6% | 26.1% |
| Range | 38.7% | 24.7% |
| Mean | 8.1% | 6.7% |
| Median | 6.5% | 6.0% |
| Interquartile 25% (IQ1) | 5.2% | 4.7% |
| Interquartile 75% (IQ3) | 8.8% | 8.3% |
| Interquartile Range (IQR) | 3.6% | 3.5% |
| Standard Deviation (Sample) | 6.3% | 4.2% |
| Standard Deviation (Population) | 6.3% | 4.2% |
Similar Demographics by Family Poverty
Demographics Similar to Poles by Family Poverty
In terms of family poverty, the demographic groups most similar to Poles are Immigrants from Japan (7.4%, a difference of 0.0%), Russian (7.5%, a difference of 0.23%), Czech (7.4%, a difference of 0.30%), Italian (7.4%, a difference of 0.42%), and Immigrants from Northern Europe (7.4%, a difference of 0.71%).
| Demographics | Rating | Rank | Family Poverty |
| Burmese | 99.7 /100 | #25 | Exceptional 7.3% |
| Cypriots | 99.6 /100 | #26 | Exceptional 7.3% |
| Immigrants | Scotland | 99.6 /100 | #27 | Exceptional 7.3% |
| Immigrants | Korea | 99.6 /100 | #28 | Exceptional 7.4% |
| Immigrants | Northern Europe | 99.6 /100 | #29 | Exceptional 7.4% |
| Italians | 99.6 /100 | #30 | Exceptional 7.4% |
| Czechs | 99.6 /100 | #31 | Exceptional 7.4% |
| Poles | 99.5 /100 | #32 | Exceptional 7.4% |
| Immigrants | Japan | 99.5 /100 | #33 | Exceptional 7.4% |
| Russians | 99.5 /100 | #34 | Exceptional 7.5% |
| Greeks | 99.4 /100 | #35 | Exceptional 7.5% |
| Turks | 99.4 /100 | #36 | Exceptional 7.5% |
| Estonians | 99.4 /100 | #37 | Exceptional 7.5% |
| Bolivians | 99.3 /100 | #38 | Exceptional 7.5% |
| Carpatho Rusyns | 99.3 /100 | #39 | Exceptional 7.5% |
Demographics Similar to Latvians by Family Poverty
In terms of family poverty, the demographic groups most similar to Latvians are Bulgarian (7.1%, a difference of 0.25%), Immigrants from Singapore (7.1%, a difference of 0.27%), Bhutanese (7.0%, a difference of 0.44%), Maltese (7.1%, a difference of 0.55%), and Swedish (7.1%, a difference of 0.60%).
| Demographics | Rating | Rank | Family Poverty |
| Chinese | 100.0 /100 | #2 | Exceptional 6.5% |
| Immigrants | Taiwan | 100.0 /100 | #3 | Exceptional 6.6% |
| Filipinos | 100.0 /100 | #4 | Exceptional 6.6% |
| Thais | 100.0 /100 | #5 | Exceptional 6.7% |
| Norwegians | 99.9 /100 | #6 | Exceptional 6.9% |
| Immigrants | Ireland | 99.9 /100 | #7 | Exceptional 7.0% |
| Bhutanese | 99.9 /100 | #8 | Exceptional 7.0% |
| Latvians | 99.9 /100 | #9 | Exceptional 7.1% |
| Bulgarians | 99.8 /100 | #10 | Exceptional 7.1% |
| Immigrants | Singapore | 99.8 /100 | #11 | Exceptional 7.1% |
| Maltese | 99.8 /100 | #12 | Exceptional 7.1% |
| Swedes | 99.8 /100 | #13 | Exceptional 7.1% |
| Iranians | 99.8 /100 | #14 | Exceptional 7.1% |
| Lithuanians | 99.8 /100 | #15 | Exceptional 7.2% |
| Immigrants | South Central Asia | 99.8 /100 | #16 | Exceptional 7.2% |