Polish vs Immigrants from France Family Poverty
COMPARE
Polish
Immigrants from France
Family Poverty
Family Poverty Comparison
Poles
Immigrants from France
7.4%
FAMILY POVERTY
99.5/ 100
METRIC RATING
32nd/ 347
METRIC RANK
8.2%
FAMILY POVERTY
94.4/ 100
METRIC RATING
112th/ 347
METRIC RANK
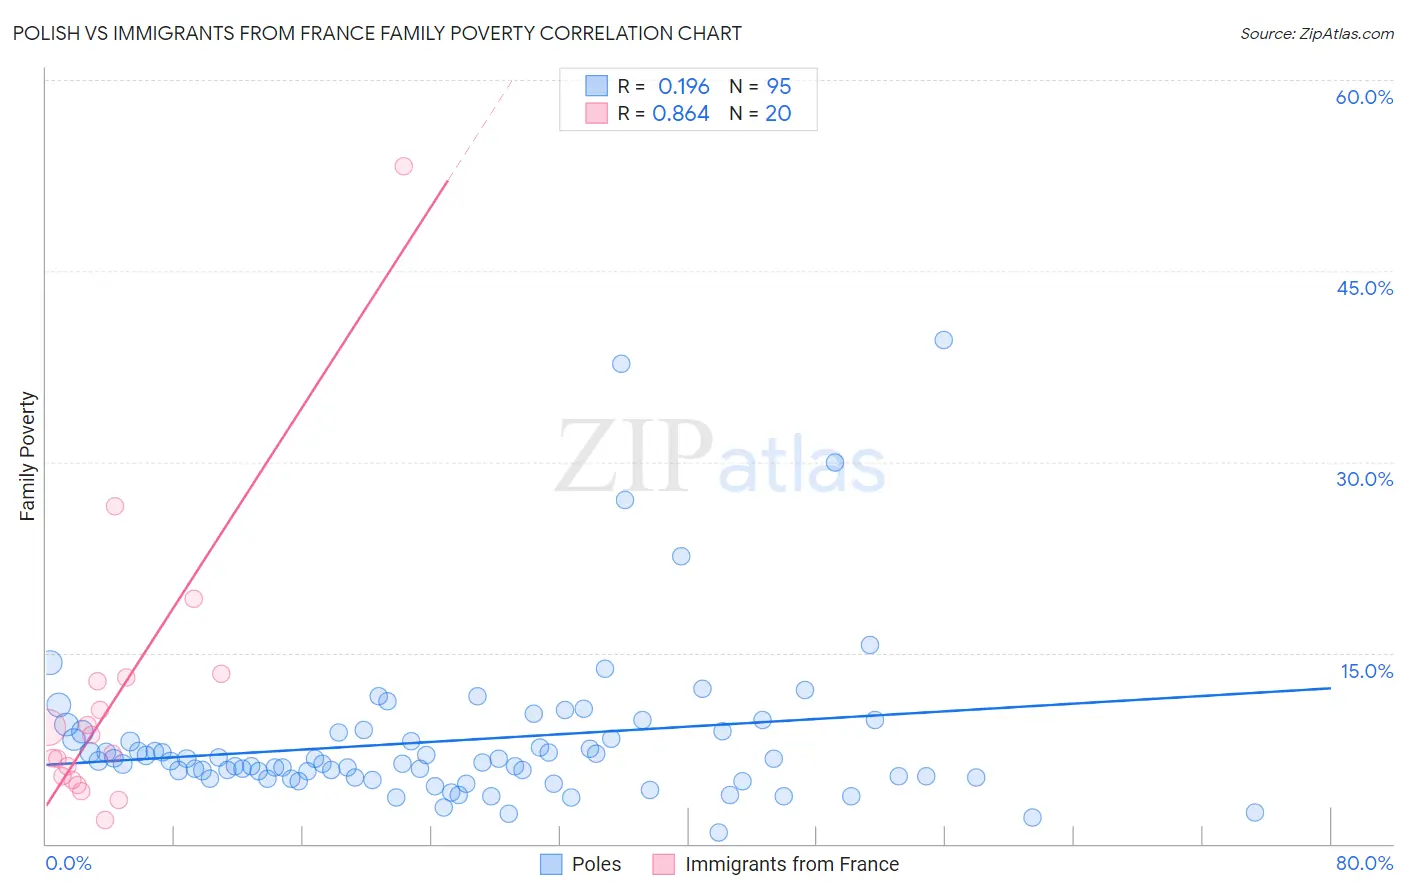
Polish vs Immigrants from France Family Poverty Correlation Chart
The statistical analysis conducted on geographies consisting of 555,842,099 people shows a poor positive correlation between the proportion of Poles and poverty level among families in the United States with a correlation coefficient (R) of 0.196 and weighted average of 7.4%. Similarly, the statistical analysis conducted on geographies consisting of 287,357,528 people shows a very strong positive correlation between the proportion of Immigrants from France and poverty level among families in the United States with a correlation coefficient (R) of 0.864 and weighted average of 8.2%, a difference of 9.9%.
Family Poverty Correlation Summary
| Measurement | Polish | Immigrants from France |
| Minimum | 0.85% | 1.9% |
| Maximum | 39.6% | 53.2% |
| Range | 38.7% | 51.3% |
| Mean | 8.1% | 11.3% |
| Median | 6.5% | 7.8% |
| Interquartile 25% (IQ1) | 5.2% | 5.2% |
| Interquartile 75% (IQ3) | 8.8% | 12.9% |
| Interquartile Range (IQR) | 3.6% | 7.7% |
| Standard Deviation (Sample) | 6.3% | 11.4% |
| Standard Deviation (Population) | 6.3% | 11.1% |
Similar Demographics by Family Poverty
Demographics Similar to Poles by Family Poverty
In terms of family poverty, the demographic groups most similar to Poles are Immigrants from Japan (7.4%, a difference of 0.0%), Russian (7.5%, a difference of 0.23%), Czech (7.4%, a difference of 0.30%), Italian (7.4%, a difference of 0.42%), and Immigrants from Northern Europe (7.4%, a difference of 0.71%).
| Demographics | Rating | Rank | Family Poverty |
| Burmese | 99.7 /100 | #25 | Exceptional 7.3% |
| Cypriots | 99.6 /100 | #26 | Exceptional 7.3% |
| Immigrants | Scotland | 99.6 /100 | #27 | Exceptional 7.3% |
| Immigrants | Korea | 99.6 /100 | #28 | Exceptional 7.4% |
| Immigrants | Northern Europe | 99.6 /100 | #29 | Exceptional 7.4% |
| Italians | 99.6 /100 | #30 | Exceptional 7.4% |
| Czechs | 99.6 /100 | #31 | Exceptional 7.4% |
| Poles | 99.5 /100 | #32 | Exceptional 7.4% |
| Immigrants | Japan | 99.5 /100 | #33 | Exceptional 7.4% |
| Russians | 99.5 /100 | #34 | Exceptional 7.5% |
| Greeks | 99.4 /100 | #35 | Exceptional 7.5% |
| Turks | 99.4 /100 | #36 | Exceptional 7.5% |
| Estonians | 99.4 /100 | #37 | Exceptional 7.5% |
| Bolivians | 99.3 /100 | #38 | Exceptional 7.5% |
| Carpatho Rusyns | 99.3 /100 | #39 | Exceptional 7.5% |
Demographics Similar to Immigrants from France by Family Poverty
In terms of family poverty, the demographic groups most similar to Immigrants from France are Taiwanese (8.2%, a difference of 0.11%), Romanian (8.2%, a difference of 0.16%), Canadian (8.2%, a difference of 0.17%), Jordanian (8.2%, a difference of 0.25%), and Immigrants from Zimbabwe (8.2%, a difference of 0.26%).
| Demographics | Rating | Rank | Family Poverty |
| Laotians | 95.6 /100 | #105 | Exceptional 8.1% |
| Egyptians | 95.1 /100 | #106 | Exceptional 8.1% |
| French Canadians | 95.0 /100 | #107 | Exceptional 8.1% |
| Basques | 94.9 /100 | #108 | Exceptional 8.1% |
| Jordanians | 94.8 /100 | #109 | Exceptional 8.2% |
| Romanians | 94.7 /100 | #110 | Exceptional 8.2% |
| Taiwanese | 94.6 /100 | #111 | Exceptional 8.2% |
| Immigrants | France | 94.4 /100 | #112 | Exceptional 8.2% |
| Canadians | 94.2 /100 | #113 | Exceptional 8.2% |
| Immigrants | Zimbabwe | 94.0 /100 | #114 | Exceptional 8.2% |
| Immigrants | Israel | 93.5 /100 | #115 | Exceptional 8.2% |
| South Africans | 93.4 /100 | #116 | Exceptional 8.2% |
| Immigrants | Russia | 93.2 /100 | #117 | Exceptional 8.2% |
| Immigrants | Western Europe | 92.9 /100 | #118 | Exceptional 8.2% |
| French | 92.8 /100 | #119 | Exceptional 8.3% |