Polish vs Ukrainian Family Poverty
COMPARE
Polish
Ukrainian
Family Poverty
Family Poverty Comparison
Poles
Ukrainians
7.4%
FAMILY POVERTY
99.5/ 100
METRIC RATING
32nd/ 347
METRIC RANK
7.9%
FAMILY POVERTY
98.0/ 100
METRIC RATING
77th/ 347
METRIC RANK
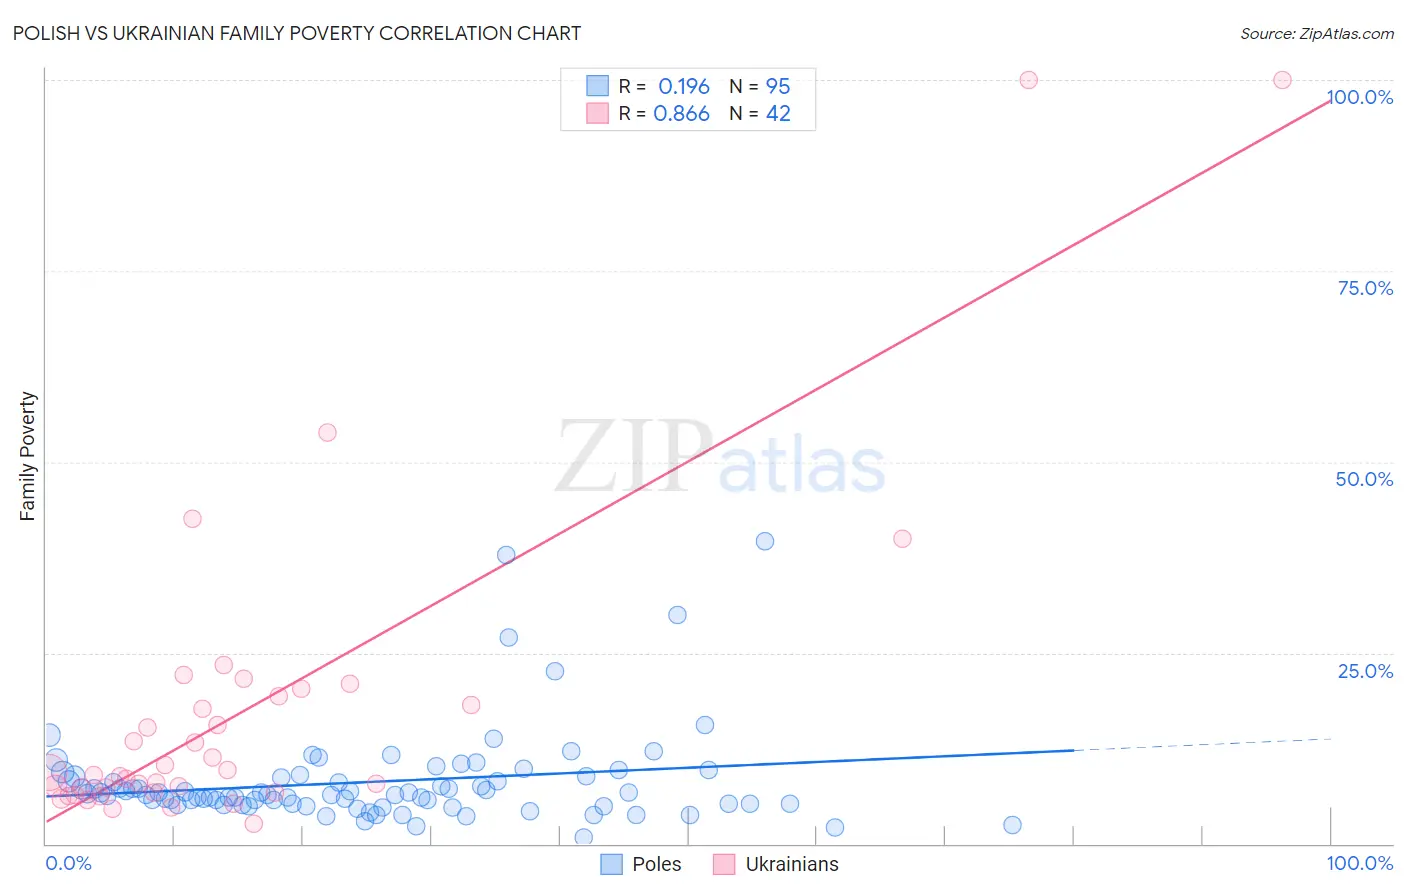
Polish vs Ukrainian Family Poverty Correlation Chart
The statistical analysis conducted on geographies consisting of 555,842,099 people shows a poor positive correlation between the proportion of Poles and poverty level among families in the United States with a correlation coefficient (R) of 0.196 and weighted average of 7.4%. Similarly, the statistical analysis conducted on geographies consisting of 446,514,525 people shows a very strong positive correlation between the proportion of Ukrainians and poverty level among families in the United States with a correlation coefficient (R) of 0.866 and weighted average of 7.9%, a difference of 5.8%.
Family Poverty Correlation Summary
| Measurement | Polish | Ukrainian |
| Minimum | 0.85% | 2.6% |
| Maximum | 39.6% | 100.0% |
| Range | 38.7% | 97.4% |
| Mean | 8.1% | 17.6% |
| Median | 6.5% | 9.2% |
| Interquartile 25% (IQ1) | 5.2% | 6.8% |
| Interquartile 75% (IQ3) | 8.8% | 19.3% |
| Interquartile Range (IQR) | 3.6% | 12.5% |
| Standard Deviation (Sample) | 6.3% | 21.5% |
| Standard Deviation (Population) | 6.3% | 21.2% |
Similar Demographics by Family Poverty
Demographics Similar to Poles by Family Poverty
In terms of family poverty, the demographic groups most similar to Poles are Immigrants from Japan (7.4%, a difference of 0.0%), Russian (7.5%, a difference of 0.23%), Czech (7.4%, a difference of 0.30%), Italian (7.4%, a difference of 0.42%), and Immigrants from Northern Europe (7.4%, a difference of 0.71%).
| Demographics | Rating | Rank | Family Poverty |
| Burmese | 99.7 /100 | #25 | Exceptional 7.3% |
| Cypriots | 99.6 /100 | #26 | Exceptional 7.3% |
| Immigrants | Scotland | 99.6 /100 | #27 | Exceptional 7.3% |
| Immigrants | Korea | 99.6 /100 | #28 | Exceptional 7.4% |
| Immigrants | Northern Europe | 99.6 /100 | #29 | Exceptional 7.4% |
| Italians | 99.6 /100 | #30 | Exceptional 7.4% |
| Czechs | 99.6 /100 | #31 | Exceptional 7.4% |
| Poles | 99.5 /100 | #32 | Exceptional 7.4% |
| Immigrants | Japan | 99.5 /100 | #33 | Exceptional 7.4% |
| Russians | 99.5 /100 | #34 | Exceptional 7.5% |
| Greeks | 99.4 /100 | #35 | Exceptional 7.5% |
| Turks | 99.4 /100 | #36 | Exceptional 7.5% |
| Estonians | 99.4 /100 | #37 | Exceptional 7.5% |
| Bolivians | 99.3 /100 | #38 | Exceptional 7.5% |
| Carpatho Rusyns | 99.3 /100 | #39 | Exceptional 7.5% |
Demographics Similar to Ukrainians by Family Poverty
In terms of family poverty, the demographic groups most similar to Ukrainians are Immigrants from Latvia (7.9%, a difference of 0.010%), Immigrants from North America (7.9%, a difference of 0.12%), Immigrants from Europe (7.9%, a difference of 0.19%), Immigrants from Croatia (7.8%, a difference of 0.24%), and English (7.9%, a difference of 0.25%).
| Demographics | Rating | Rank | Family Poverty |
| Immigrants | Canada | 98.2 /100 | #70 | Exceptional 7.8% |
| Cambodians | 98.2 /100 | #71 | Exceptional 7.8% |
| Immigrants | Romania | 98.2 /100 | #72 | Exceptional 7.8% |
| Austrians | 98.2 /100 | #73 | Exceptional 7.8% |
| Immigrants | China | 98.1 /100 | #74 | Exceptional 7.8% |
| Immigrants | Croatia | 98.1 /100 | #75 | Exceptional 7.8% |
| Immigrants | Latvia | 98.0 /100 | #76 | Exceptional 7.9% |
| Ukrainians | 98.0 /100 | #77 | Exceptional 7.9% |
| Immigrants | North America | 97.9 /100 | #78 | Exceptional 7.9% |
| Immigrants | Europe | 97.8 /100 | #79 | Exceptional 7.9% |
| English | 97.8 /100 | #80 | Exceptional 7.9% |
| Irish | 97.8 /100 | #81 | Exceptional 7.9% |
| Immigrants | Poland | 97.8 /100 | #82 | Exceptional 7.9% |
| Slovaks | 97.7 /100 | #83 | Exceptional 7.9% |
| British | 97.5 /100 | #84 | Exceptional 7.9% |