Polish vs Latvian Householder Income Ages 25 - 44 years
COMPARE
Polish
Latvian
Householder Income Ages 25 - 44 years
Householder Income Ages 25 - 44 years Comparison
Poles
Latvians
$99,685
HOUSEHOLDER INCOME AGES 25 - 44 YEARS
94.5/ 100
METRIC RATING
112th/ 347
METRIC RANK
$108,926
HOUSEHOLDER INCOME AGES 25 - 44 YEARS
100.0/ 100
METRIC RATING
36th/ 347
METRIC RANK
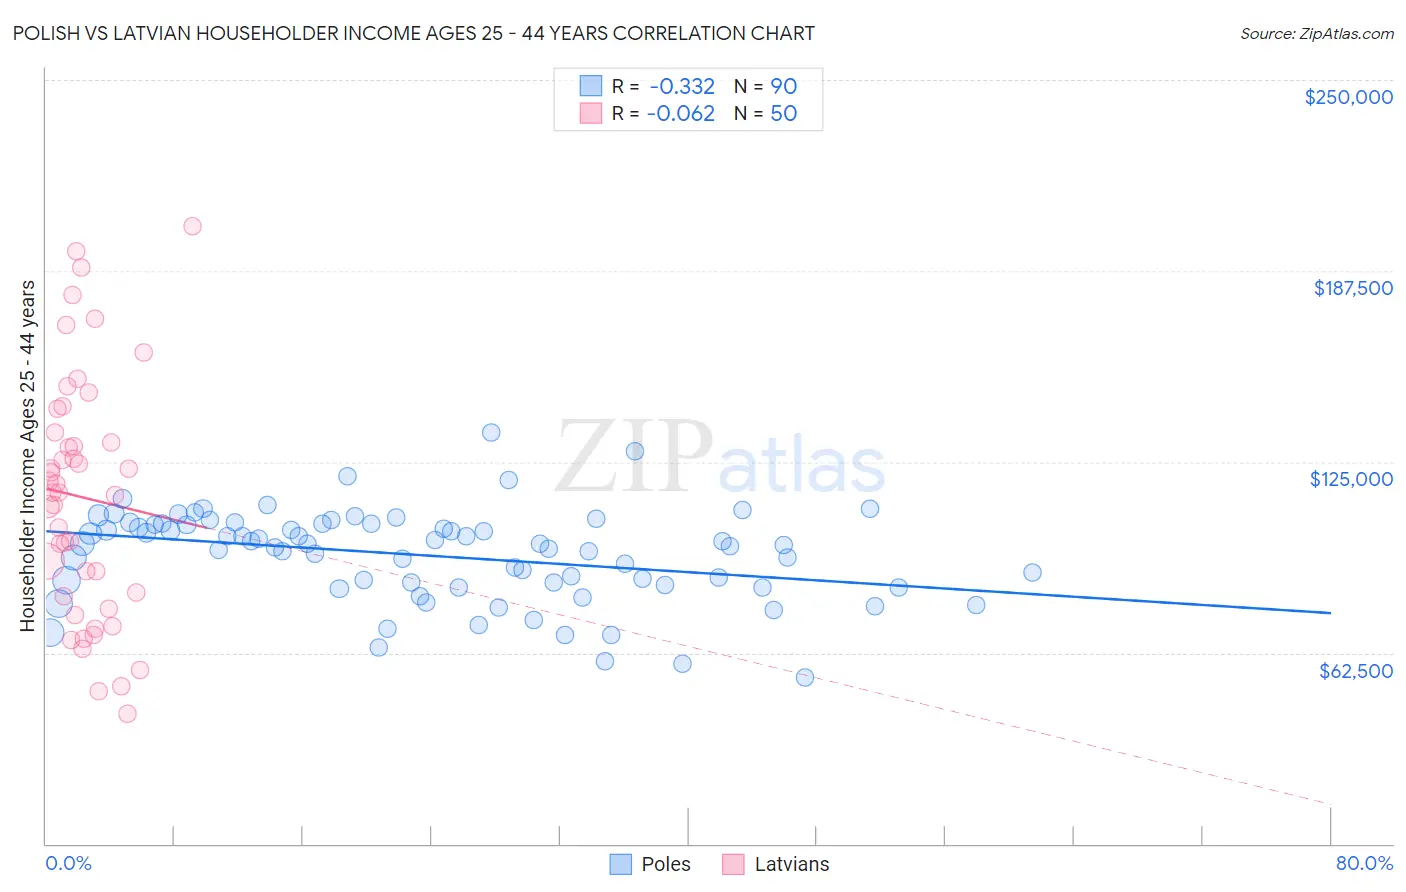
Polish vs Latvian Householder Income Ages 25 - 44 years Correlation Chart
The statistical analysis conducted on geographies consisting of 555,649,021 people shows a mild negative correlation between the proportion of Poles and household income with householder between the ages 25 and 44 in the United States with a correlation coefficient (R) of -0.332 and weighted average of $99,685. Similarly, the statistical analysis conducted on geographies consisting of 220,250,267 people shows a slight negative correlation between the proportion of Latvians and household income with householder between the ages 25 and 44 in the United States with a correlation coefficient (R) of -0.062 and weighted average of $108,926, a difference of 9.3%.
Householder Income Ages 25 - 44 years Correlation Summary
| Measurement | Polish | Latvian |
| Minimum | $54,279 | $42,679 |
| Maximum | $134,668 | $202,188 |
| Range | $80,389 | $159,509 |
| Mean | $94,388 | $113,340 |
| Median | $97,963 | $114,915 |
| Interquartile 25% (IQ1) | $84,559 | $80,877 |
| Interquartile 75% (IQ3) | $104,554 | $134,488 |
| Interquartile Range (IQR) | $19,995 | $53,611 |
| Standard Deviation (Sample) | $15,033 | $39,584 |
| Standard Deviation (Population) | $14,949 | $39,186 |
Similar Demographics by Householder Income Ages 25 - 44 years
Demographics Similar to Poles by Householder Income Ages 25 - 44 years
In terms of householder income ages 25 - 44 years, the demographic groups most similar to Poles are Tongan ($99,604, a difference of 0.080%), Immigrants from Western Asia ($99,516, a difference of 0.17%), Chilean ($99,900, a difference of 0.22%), Carpatho Rusyn ($99,449, a difference of 0.24%), and Portuguese ($99,429, a difference of 0.26%).
| Demographics | Rating | Rank | Householder Income Ages 25 - 44 years |
| Immigrants | Vietnam | 96.5 /100 | #105 | Exceptional $100,535 |
| Immigrants | Brazil | 96.5 /100 | #106 | Exceptional $100,534 |
| Northern Europeans | 96.3 /100 | #107 | Exceptional $100,457 |
| Immigrants | South Eastern Asia | 96.0 /100 | #108 | Exceptional $100,283 |
| Immigrants | North Macedonia | 95.6 /100 | #109 | Exceptional $100,101 |
| Immigrants | Afghanistan | 95.3 /100 | #110 | Exceptional $99,977 |
| Chileans | 95.1 /100 | #111 | Exceptional $99,900 |
| Poles | 94.5 /100 | #112 | Exceptional $99,685 |
| Tongans | 94.2 /100 | #113 | Exceptional $99,604 |
| Immigrants | Western Asia | 94.0 /100 | #114 | Exceptional $99,516 |
| Carpatho Rusyns | 93.7 /100 | #115 | Exceptional $99,449 |
| Portuguese | 93.7 /100 | #116 | Exceptional $99,429 |
| Immigrants | Northern Africa | 93.0 /100 | #117 | Exceptional $99,232 |
| Syrians | 92.9 /100 | #118 | Exceptional $99,215 |
| Jordanians | 92.8 /100 | #119 | Exceptional $99,186 |
Demographics Similar to Latvians by Householder Income Ages 25 - 44 years
In terms of householder income ages 25 - 44 years, the demographic groups most similar to Latvians are Immigrants from Russia ($108,751, a difference of 0.16%), Immigrants from Switzerland ($109,185, a difference of 0.24%), Bolivian ($109,372, a difference of 0.41%), Soviet Union ($108,457, a difference of 0.43%), and Bhutanese ($109,520, a difference of 0.55%).
| Demographics | Rating | Rank | Householder Income Ages 25 - 44 years |
| Turks | 100.0 /100 | #29 | Exceptional $110,318 |
| Immigrants | Greece | 100.0 /100 | #30 | Exceptional $110,103 |
| Maltese | 100.0 /100 | #31 | Exceptional $110,064 |
| Immigrants | Sri Lanka | 100.0 /100 | #32 | Exceptional $109,741 |
| Bhutanese | 100.0 /100 | #33 | Exceptional $109,520 |
| Bolivians | 100.0 /100 | #34 | Exceptional $109,372 |
| Immigrants | Switzerland | 100.0 /100 | #35 | Exceptional $109,185 |
| Latvians | 100.0 /100 | #36 | Exceptional $108,926 |
| Immigrants | Russia | 100.0 /100 | #37 | Exceptional $108,751 |
| Soviet Union | 100.0 /100 | #38 | Exceptional $108,457 |
| Immigrants | France | 99.9 /100 | #39 | Exceptional $108,257 |
| Immigrants | Lithuania | 99.9 /100 | #40 | Exceptional $108,149 |
| Immigrants | Bolivia | 99.9 /100 | #41 | Exceptional $108,128 |
| Australians | 99.9 /100 | #42 | Exceptional $107,912 |
| Immigrants | Malaysia | 99.9 /100 | #43 | Exceptional $107,650 |