Polish vs Immigrants from Grenada Family Poverty
COMPARE
Polish
Immigrants from Grenada
Family Poverty
Family Poverty Comparison
Poles
Immigrants from Grenada
7.4%
FAMILY POVERTY
99.5/ 100
METRIC RATING
32nd/ 347
METRIC RANK
12.4%
FAMILY POVERTY
0.0/ 100
METRIC RATING
317th/ 347
METRIC RANK
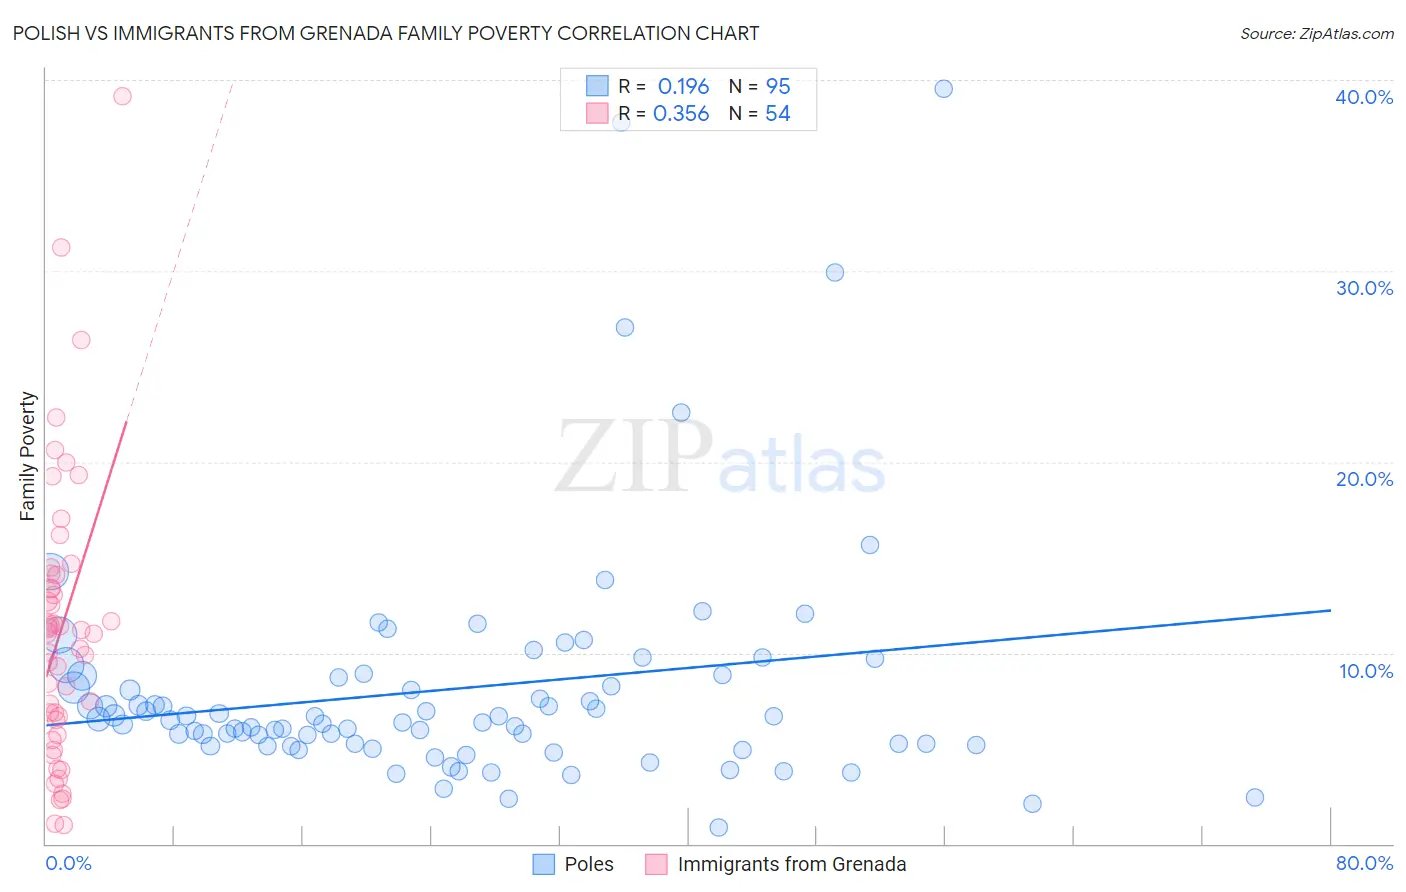
Polish vs Immigrants from Grenada Family Poverty Correlation Chart
The statistical analysis conducted on geographies consisting of 555,842,099 people shows a poor positive correlation between the proportion of Poles and poverty level among families in the United States with a correlation coefficient (R) of 0.196 and weighted average of 7.4%. Similarly, the statistical analysis conducted on geographies consisting of 67,148,285 people shows a mild positive correlation between the proportion of Immigrants from Grenada and poverty level among families in the United States with a correlation coefficient (R) of 0.356 and weighted average of 12.4%, a difference of 66.7%.
Family Poverty Correlation Summary
| Measurement | Polish | Immigrants from Grenada |
| Minimum | 0.85% | 0.96% |
| Maximum | 39.6% | 39.2% |
| Range | 38.7% | 38.2% |
| Mean | 8.1% | 11.3% |
| Median | 6.5% | 11.0% |
| Interquartile 25% (IQ1) | 5.2% | 6.5% |
| Interquartile 75% (IQ3) | 8.8% | 14.1% |
| Interquartile Range (IQR) | 3.6% | 7.6% |
| Standard Deviation (Sample) | 6.3% | 7.4% |
| Standard Deviation (Population) | 6.3% | 7.3% |
Similar Demographics by Family Poverty
Demographics Similar to Poles by Family Poverty
In terms of family poverty, the demographic groups most similar to Poles are Immigrants from Japan (7.4%, a difference of 0.0%), Russian (7.5%, a difference of 0.23%), Czech (7.4%, a difference of 0.30%), Italian (7.4%, a difference of 0.42%), and Immigrants from Northern Europe (7.4%, a difference of 0.71%).
| Demographics | Rating | Rank | Family Poverty |
| Burmese | 99.7 /100 | #25 | Exceptional 7.3% |
| Cypriots | 99.6 /100 | #26 | Exceptional 7.3% |
| Immigrants | Scotland | 99.6 /100 | #27 | Exceptional 7.3% |
| Immigrants | Korea | 99.6 /100 | #28 | Exceptional 7.4% |
| Immigrants | Northern Europe | 99.6 /100 | #29 | Exceptional 7.4% |
| Italians | 99.6 /100 | #30 | Exceptional 7.4% |
| Czechs | 99.6 /100 | #31 | Exceptional 7.4% |
| Poles | 99.5 /100 | #32 | Exceptional 7.4% |
| Immigrants | Japan | 99.5 /100 | #33 | Exceptional 7.4% |
| Russians | 99.5 /100 | #34 | Exceptional 7.5% |
| Greeks | 99.4 /100 | #35 | Exceptional 7.5% |
| Turks | 99.4 /100 | #36 | Exceptional 7.5% |
| Estonians | 99.4 /100 | #37 | Exceptional 7.5% |
| Bolivians | 99.3 /100 | #38 | Exceptional 7.5% |
| Carpatho Rusyns | 99.3 /100 | #39 | Exceptional 7.5% |
Demographics Similar to Immigrants from Grenada by Family Poverty
In terms of family poverty, the demographic groups most similar to Immigrants from Grenada are U.S. Virgin Islander (12.4%, a difference of 0.010%), British West Indian (12.4%, a difference of 0.060%), Honduran (12.4%, a difference of 0.22%), Inupiat (12.5%, a difference of 0.54%), and Immigrants from Mexico (12.3%, a difference of 0.96%).
| Demographics | Rating | Rank | Family Poverty |
| Immigrants | Guatemala | 0.0 /100 | #310 | Tragic 12.0% |
| Ute | 0.0 /100 | #311 | Tragic 12.1% |
| Immigrants | Central America | 0.0 /100 | #312 | Tragic 12.1% |
| Immigrants | Caribbean | 0.0 /100 | #313 | Tragic 12.2% |
| Kiowa | 0.0 /100 | #314 | Tragic 12.2% |
| Immigrants | Mexico | 0.0 /100 | #315 | Tragic 12.3% |
| Hondurans | 0.0 /100 | #316 | Tragic 12.4% |
| Immigrants | Grenada | 0.0 /100 | #317 | Tragic 12.4% |
| U.S. Virgin Islanders | 0.0 /100 | #318 | Tragic 12.4% |
| British West Indians | 0.0 /100 | #319 | Tragic 12.4% |
| Inupiat | 0.0 /100 | #320 | Tragic 12.5% |
| Arapaho | 0.0 /100 | #321 | Tragic 12.7% |
| Immigrants | Honduras | 0.0 /100 | #322 | Tragic 12.7% |
| Menominee | 0.0 /100 | #323 | Tragic 12.7% |
| Immigrants | Dominica | 0.0 /100 | #324 | Tragic 12.7% |