Hmong vs Latvian Family Poverty
COMPARE
Hmong
Latvian
Family Poverty
Family Poverty Comparison
Hmong
Latvians
9.1%
FAMILY POVERTY
40.2/ 100
METRIC RATING
181st/ 347
METRIC RANK
7.1%
FAMILY POVERTY
99.9/ 100
METRIC RATING
9th/ 347
METRIC RANK
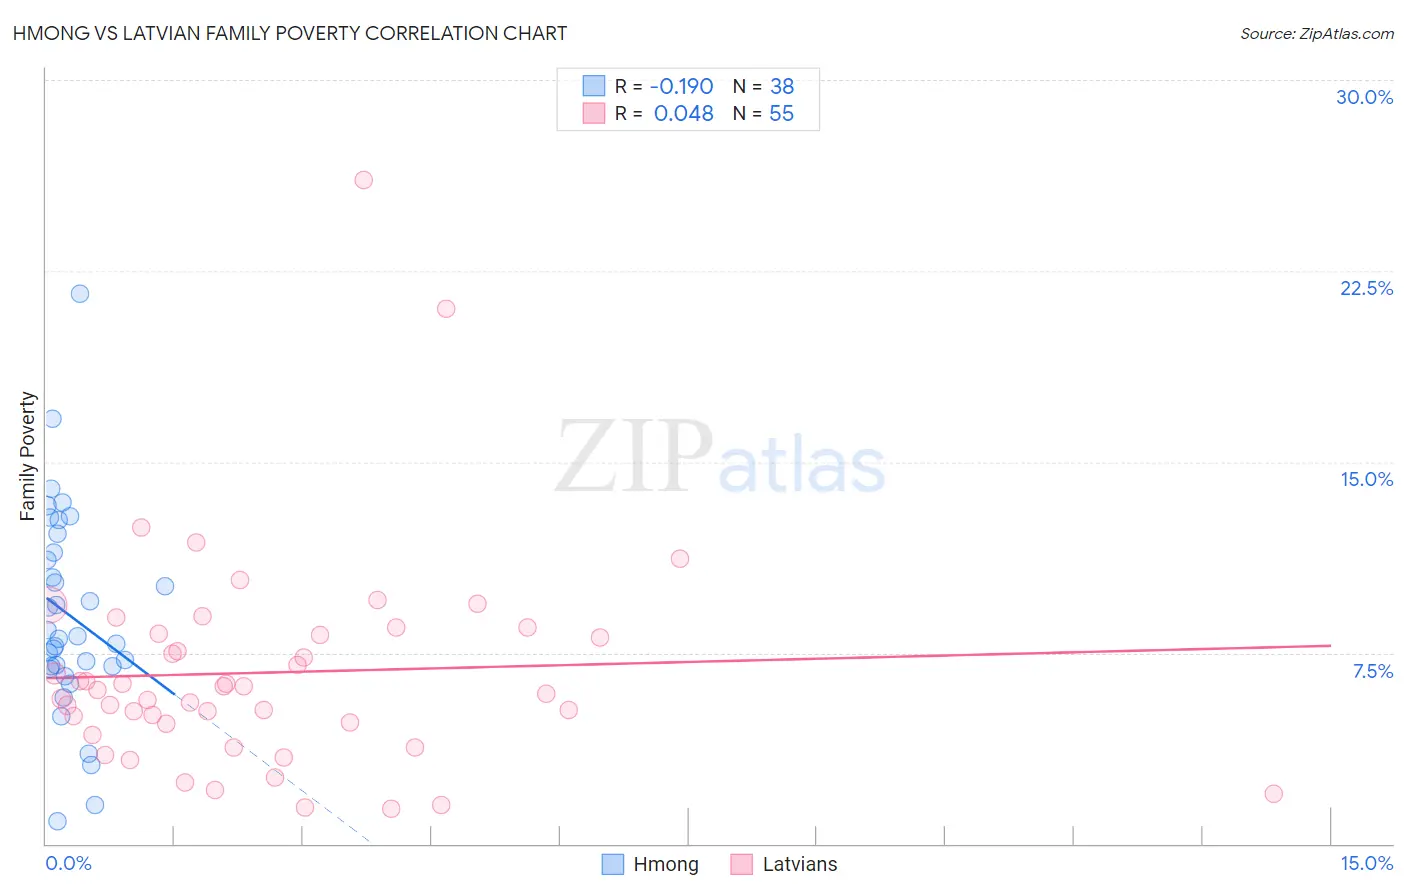
Hmong vs Latvian Family Poverty Correlation Chart
The statistical analysis conducted on geographies consisting of 24,669,739 people shows a poor negative correlation between the proportion of Hmong and poverty level among families in the United States with a correlation coefficient (R) of -0.190 and weighted average of 9.1%. Similarly, the statistical analysis conducted on geographies consisting of 220,290,550 people shows no correlation between the proportion of Latvians and poverty level among families in the United States with a correlation coefficient (R) of 0.048 and weighted average of 7.1%, a difference of 28.9%.
Family Poverty Correlation Summary
| Measurement | Hmong | Latvian |
| Minimum | 0.91% | 1.4% |
| Maximum | 21.6% | 26.1% |
| Range | 20.7% | 24.7% |
| Mean | 9.0% | 6.7% |
| Median | 8.1% | 6.0% |
| Interquartile 25% (IQ1) | 7.0% | 4.7% |
| Interquartile 75% (IQ3) | 11.4% | 8.3% |
| Interquartile Range (IQR) | 4.5% | 3.5% |
| Standard Deviation (Sample) | 4.1% | 4.2% |
| Standard Deviation (Population) | 4.0% | 4.2% |
Similar Demographics by Family Poverty
Demographics Similar to Hmong by Family Poverty
In terms of family poverty, the demographic groups most similar to Hmong are Immigrants from Morocco (9.1%, a difference of 0.010%), Uruguayan (9.1%, a difference of 0.14%), South American Indian (9.1%, a difference of 0.21%), Immigrants from Saudi Arabia (9.1%, a difference of 0.22%), and Immigrants from Uganda (9.1%, a difference of 0.43%).
| Demographics | Rating | Rank | Family Poverty |
| Immigrants | Albania | 50.0 /100 | #174 | Average 9.0% |
| Costa Ricans | 49.3 /100 | #175 | Average 9.0% |
| Immigrants | Syria | 47.5 /100 | #176 | Average 9.0% |
| Hawaiians | 47.2 /100 | #177 | Average 9.0% |
| Immigrants | Cameroon | 47.1 /100 | #178 | Average 9.0% |
| Immigrants | Iraq | 44.4 /100 | #179 | Average 9.1% |
| Immigrants | Uganda | 43.4 /100 | #180 | Average 9.1% |
| Hmong | 40.2 /100 | #181 | Average 9.1% |
| Immigrants | Morocco | 40.2 /100 | #182 | Average 9.1% |
| Uruguayans | 39.2 /100 | #183 | Fair 9.1% |
| South American Indians | 38.7 /100 | #184 | Fair 9.1% |
| Immigrants | Saudi Arabia | 38.6 /100 | #185 | Fair 9.1% |
| Colombians | 36.1 /100 | #186 | Fair 9.2% |
| Delaware | 35.4 /100 | #187 | Fair 9.2% |
| Immigrants | Kenya | 34.0 /100 | #188 | Fair 9.2% |
Demographics Similar to Latvians by Family Poverty
In terms of family poverty, the demographic groups most similar to Latvians are Bulgarian (7.1%, a difference of 0.25%), Immigrants from Singapore (7.1%, a difference of 0.27%), Bhutanese (7.0%, a difference of 0.44%), Maltese (7.1%, a difference of 0.55%), and Swedish (7.1%, a difference of 0.60%).
| Demographics | Rating | Rank | Family Poverty |
| Chinese | 100.0 /100 | #2 | Exceptional 6.5% |
| Immigrants | Taiwan | 100.0 /100 | #3 | Exceptional 6.6% |
| Filipinos | 100.0 /100 | #4 | Exceptional 6.6% |
| Thais | 100.0 /100 | #5 | Exceptional 6.7% |
| Norwegians | 99.9 /100 | #6 | Exceptional 6.9% |
| Immigrants | Ireland | 99.9 /100 | #7 | Exceptional 7.0% |
| Bhutanese | 99.9 /100 | #8 | Exceptional 7.0% |
| Latvians | 99.9 /100 | #9 | Exceptional 7.1% |
| Bulgarians | 99.8 /100 | #10 | Exceptional 7.1% |
| Immigrants | Singapore | 99.8 /100 | #11 | Exceptional 7.1% |
| Maltese | 99.8 /100 | #12 | Exceptional 7.1% |
| Swedes | 99.8 /100 | #13 | Exceptional 7.1% |
| Iranians | 99.8 /100 | #14 | Exceptional 7.1% |
| Lithuanians | 99.8 /100 | #15 | Exceptional 7.2% |
| Immigrants | South Central Asia | 99.8 /100 | #16 | Exceptional 7.2% |