Immigrants from Korea vs Latvian Family Poverty
COMPARE
Immigrants from Korea
Latvian
Family Poverty
Family Poverty Comparison
Immigrants from Korea
Latvians
7.4%
FAMILY POVERTY
99.6/ 100
METRIC RATING
28th/ 347
METRIC RANK
7.1%
FAMILY POVERTY
99.9/ 100
METRIC RATING
9th/ 347
METRIC RANK
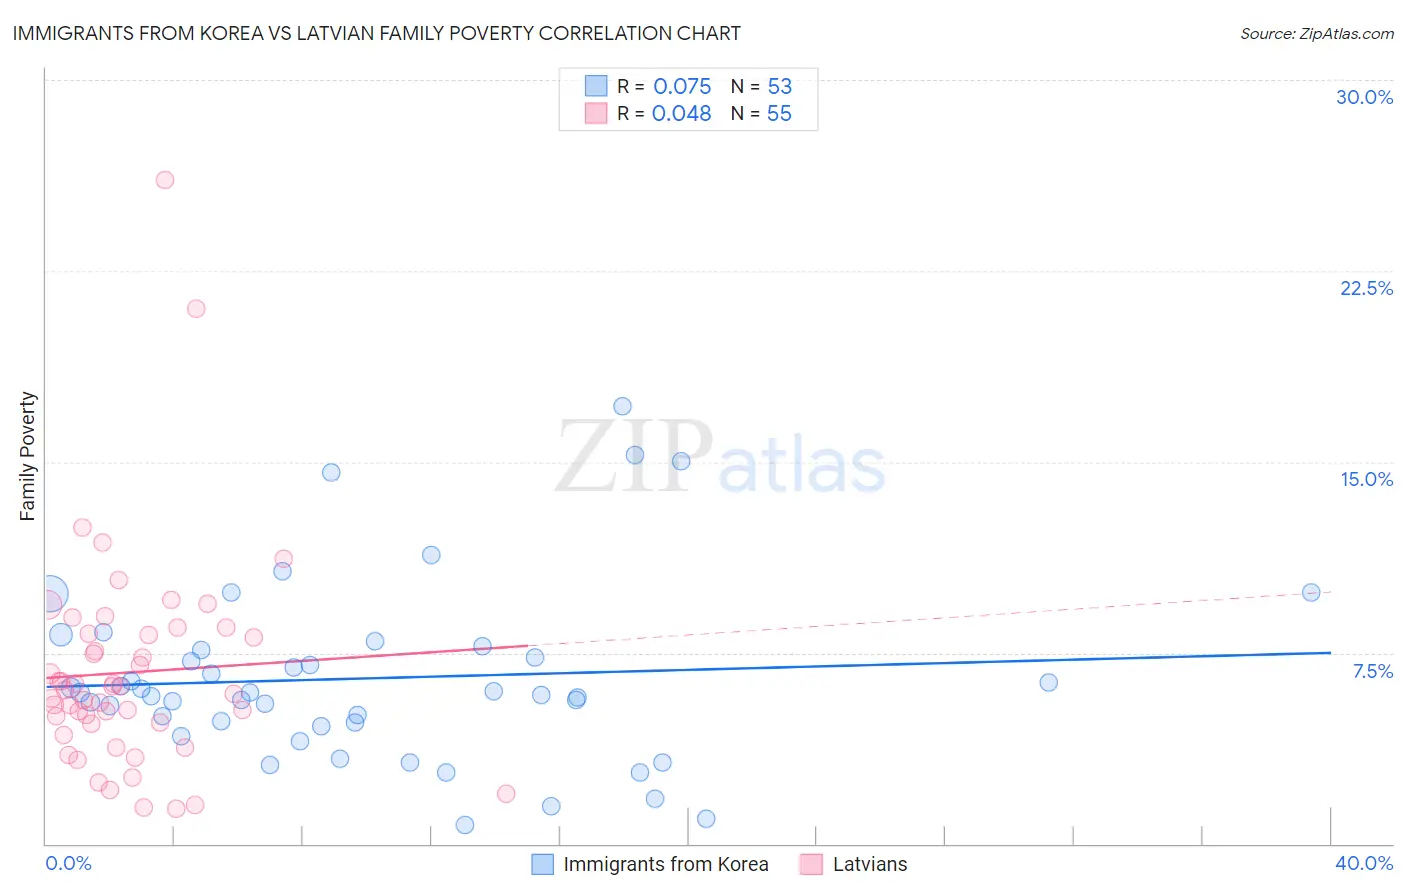
Immigrants from Korea vs Latvian Family Poverty Correlation Chart
The statistical analysis conducted on geographies consisting of 414,824,351 people shows a slight positive correlation between the proportion of Immigrants from Korea and poverty level among families in the United States with a correlation coefficient (R) of 0.075 and weighted average of 7.4%. Similarly, the statistical analysis conducted on geographies consisting of 220,290,550 people shows no correlation between the proportion of Latvians and poverty level among families in the United States with a correlation coefficient (R) of 0.048 and weighted average of 7.1%, a difference of 4.1%.
Family Poverty Correlation Summary
| Measurement | Immigrants from Korea | Latvian |
| Minimum | 0.76% | 1.4% |
| Maximum | 17.2% | 26.1% |
| Range | 16.4% | 24.7% |
| Mean | 6.5% | 6.7% |
| Median | 5.9% | 6.0% |
| Interquartile 25% (IQ1) | 4.7% | 4.7% |
| Interquartile 75% (IQ3) | 7.7% | 8.3% |
| Interquartile Range (IQR) | 3.0% | 3.5% |
| Standard Deviation (Sample) | 3.5% | 4.2% |
| Standard Deviation (Population) | 3.5% | 4.2% |
Demographics Similar to Immigrants from Korea and Latvians by Family Poverty
In terms of family poverty, the demographic groups most similar to Immigrants from Korea are Immigrants from Scotland (7.3%, a difference of 0.39%), Cypriot (7.3%, a difference of 0.40%), Croatian (7.3%, a difference of 0.65%), Burmese (7.3%, a difference of 0.65%), and Assyrian/Chaldean/Syriac (7.3%, a difference of 0.95%). Similarly, the demographic groups most similar to Latvians are Bulgarian (7.1%, a difference of 0.25%), Immigrants from Singapore (7.1%, a difference of 0.27%), Bhutanese (7.0%, a difference of 0.44%), Maltese (7.1%, a difference of 0.55%), and Swedish (7.1%, a difference of 0.60%).
| Demographics | Rating | Rank | Family Poverty |
| Bhutanese | 99.9 /100 | #8 | Exceptional 7.0% |
| Latvians | 99.9 /100 | #9 | Exceptional 7.1% |
| Bulgarians | 99.8 /100 | #10 | Exceptional 7.1% |
| Immigrants | Singapore | 99.8 /100 | #11 | Exceptional 7.1% |
| Maltese | 99.8 /100 | #12 | Exceptional 7.1% |
| Swedes | 99.8 /100 | #13 | Exceptional 7.1% |
| Iranians | 99.8 /100 | #14 | Exceptional 7.1% |
| Lithuanians | 99.8 /100 | #15 | Exceptional 7.2% |
| Immigrants | South Central Asia | 99.8 /100 | #16 | Exceptional 7.2% |
| Luxembourgers | 99.8 /100 | #17 | Exceptional 7.2% |
| Immigrants | Lithuania | 99.8 /100 | #18 | Exceptional 7.2% |
| Eastern Europeans | 99.7 /100 | #19 | Exceptional 7.2% |
| Immigrants | Hong Kong | 99.7 /100 | #20 | Exceptional 7.3% |
| Immigrants | Iran | 99.7 /100 | #21 | Exceptional 7.3% |
| Danes | 99.7 /100 | #22 | Exceptional 7.3% |
| Assyrians/Chaldeans/Syriacs | 99.7 /100 | #23 | Exceptional 7.3% |
| Croatians | 99.7 /100 | #24 | Exceptional 7.3% |
| Burmese | 99.7 /100 | #25 | Exceptional 7.3% |
| Cypriots | 99.6 /100 | #26 | Exceptional 7.3% |
| Immigrants | Scotland | 99.6 /100 | #27 | Exceptional 7.3% |
| Immigrants | Korea | 99.6 /100 | #28 | Exceptional 7.4% |