Polish vs Brazilian Receiving Food Stamps
COMPARE
Polish
Brazilian
Receiving Food Stamps
Receiving Food Stamps Comparison
Poles
Brazilians
10.0%
RECEIVING FOOD STAMPS
98.6/ 100
METRIC RATING
80th/ 347
METRIC RANK
11.1%
RECEIVING FOOD STAMPS
83.2/ 100
METRIC RATING
149th/ 347
METRIC RANK
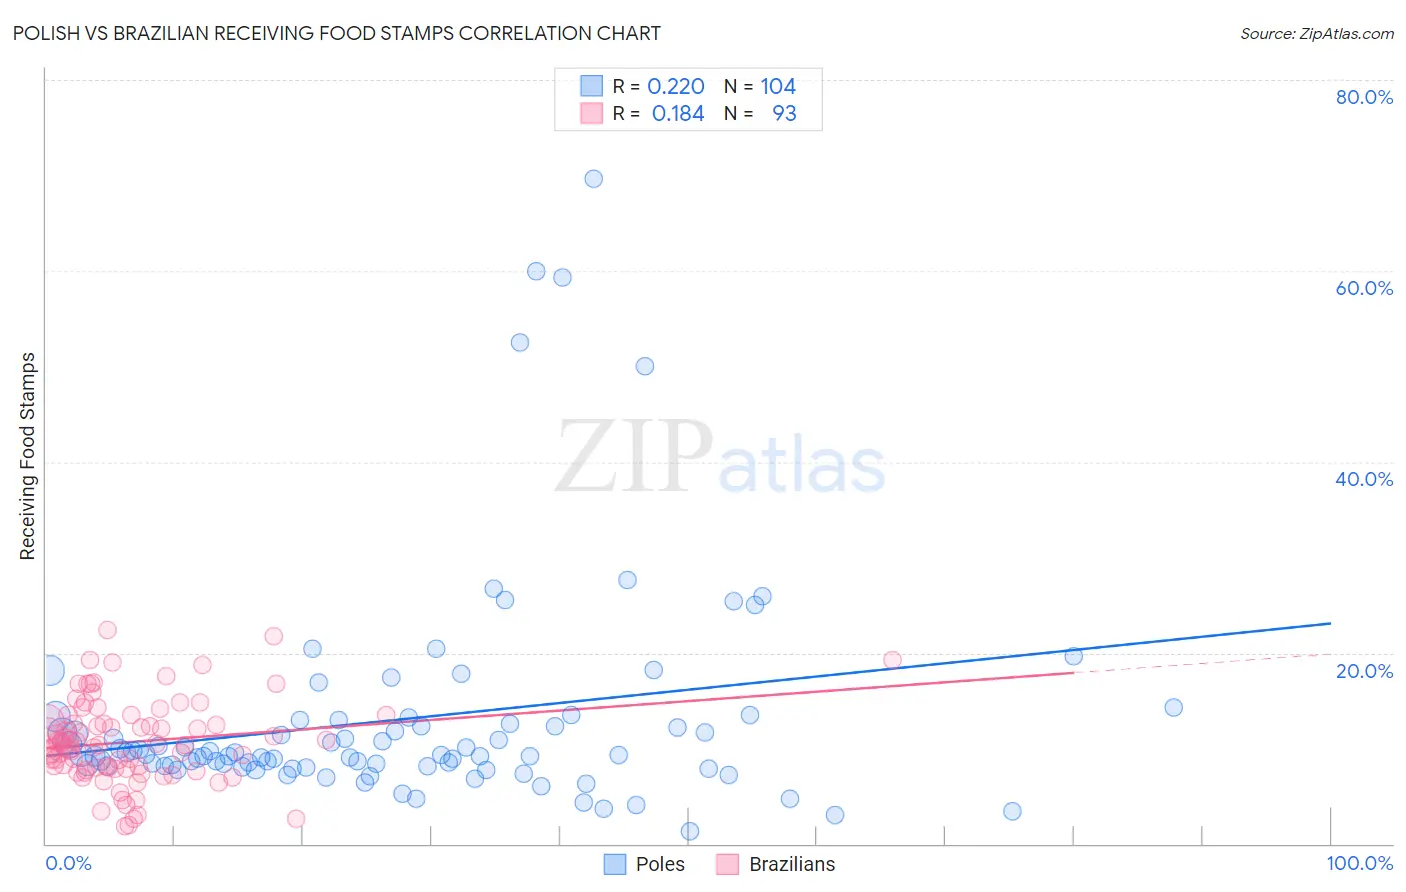
Polish vs Brazilian Receiving Food Stamps Correlation Chart
The statistical analysis conducted on geographies consisting of 556,985,146 people shows a weak positive correlation between the proportion of Poles and percentage of population receiving government assistance and/or food stamps in the United States with a correlation coefficient (R) of 0.220 and weighted average of 10.0%. Similarly, the statistical analysis conducted on geographies consisting of 322,932,120 people shows a poor positive correlation between the proportion of Brazilians and percentage of population receiving government assistance and/or food stamps in the United States with a correlation coefficient (R) of 0.184 and weighted average of 11.1%, a difference of 11.1%.
Receiving Food Stamps Correlation Summary
| Measurement | Polish | Brazilian |
| Minimum | 1.3% | 1.8% |
| Maximum | 69.7% | 22.4% |
| Range | 68.4% | 20.6% |
| Mean | 13.0% | 10.7% |
| Median | 9.3% | 10.3% |
| Interquartile 25% (IQ1) | 8.1% | 7.8% |
| Interquartile 75% (IQ3) | 12.7% | 13.1% |
| Interquartile Range (IQR) | 4.6% | 5.3% |
| Standard Deviation (Sample) | 11.6% | 4.4% |
| Standard Deviation (Population) | 11.5% | 4.3% |
Similar Demographics by Receiving Food Stamps
Demographics Similar to Poles by Receiving Food Stamps
In terms of receiving food stamps, the demographic groups most similar to Poles are Laotian (10.0%, a difference of 0.080%), South African (10.0%, a difference of 0.12%), Immigrants from England (10.0%, a difference of 0.14%), Immigrants from North Macedonia (10.0%, a difference of 0.16%), and Immigrants from Croatia (10.0%, a difference of 0.25%).
| Demographics | Rating | Rank | Receiving Food Stamps |
| Macedonians | 98.9 /100 | #73 | Exceptional 9.9% |
| New Zealanders | 98.8 /100 | #74 | Exceptional 9.9% |
| Immigrants | Zimbabwe | 98.7 /100 | #75 | Exceptional 9.9% |
| Immigrants | Croatia | 98.7 /100 | #76 | Exceptional 10.0% |
| Immigrants | North Macedonia | 98.7 /100 | #77 | Exceptional 10.0% |
| South Africans | 98.7 /100 | #78 | Exceptional 10.0% |
| Laotians | 98.7 /100 | #79 | Exceptional 10.0% |
| Poles | 98.6 /100 | #80 | Exceptional 10.0% |
| Immigrants | England | 98.6 /100 | #81 | Exceptional 10.0% |
| Austrians | 98.6 /100 | #82 | Exceptional 10.0% |
| Dutch | 98.6 /100 | #83 | Exceptional 10.0% |
| Immigrants | Israel | 98.5 /100 | #84 | Exceptional 10.0% |
| Immigrants | Romania | 98.5 /100 | #85 | Exceptional 10.0% |
| Immigrants | Norway | 98.4 /100 | #86 | Exceptional 10.0% |
| Egyptians | 98.4 /100 | #87 | Exceptional 10.0% |
Demographics Similar to Brazilians by Receiving Food Stamps
In terms of receiving food stamps, the demographic groups most similar to Brazilians are Immigrants from South Eastern Asia (11.1%, a difference of 0.020%), Soviet Union (11.1%, a difference of 0.020%), White/Caucasian (11.1%, a difference of 0.18%), Taiwanese (11.0%, a difference of 0.28%), and Immigrants from Spain (11.1%, a difference of 0.38%).
| Demographics | Rating | Rank | Receiving Food Stamps |
| Chileans | 86.2 /100 | #142 | Excellent 11.0% |
| Immigrants | Northern Africa | 86.0 /100 | #143 | Excellent 11.0% |
| Syrians | 85.5 /100 | #144 | Excellent 11.0% |
| Hungarians | 85.1 /100 | #145 | Excellent 11.0% |
| Taiwanese | 84.2 /100 | #146 | Excellent 11.0% |
| Whites/Caucasians | 83.9 /100 | #147 | Excellent 11.1% |
| Immigrants | South Eastern Asia | 83.3 /100 | #148 | Excellent 11.1% |
| Brazilians | 83.2 /100 | #149 | Excellent 11.1% |
| Soviet Union | 83.1 /100 | #150 | Excellent 11.1% |
| Immigrants | Spain | 81.7 /100 | #151 | Excellent 11.1% |
| Immigrants | Kazakhstan | 81.7 /100 | #152 | Excellent 11.1% |
| Lebanese | 81.6 /100 | #153 | Excellent 11.1% |
| Armenians | 81.4 /100 | #154 | Excellent 11.1% |
| Immigrants | Argentina | 80.4 /100 | #155 | Excellent 11.2% |
| Immigrants | Afghanistan | 75.6 /100 | #156 | Good 11.3% |