Polish vs Immigrants from Latvia Receiving Food Stamps
COMPARE
Polish
Immigrants from Latvia
Receiving Food Stamps
Receiving Food Stamps Comparison
Poles
Immigrants from Latvia
10.0%
RECEIVING FOOD STAMPS
98.6/ 100
METRIC RATING
80th/ 347
METRIC RANK
10.3%
RECEIVING FOOD STAMPS
96.8/ 100
METRIC RATING
103rd/ 347
METRIC RANK
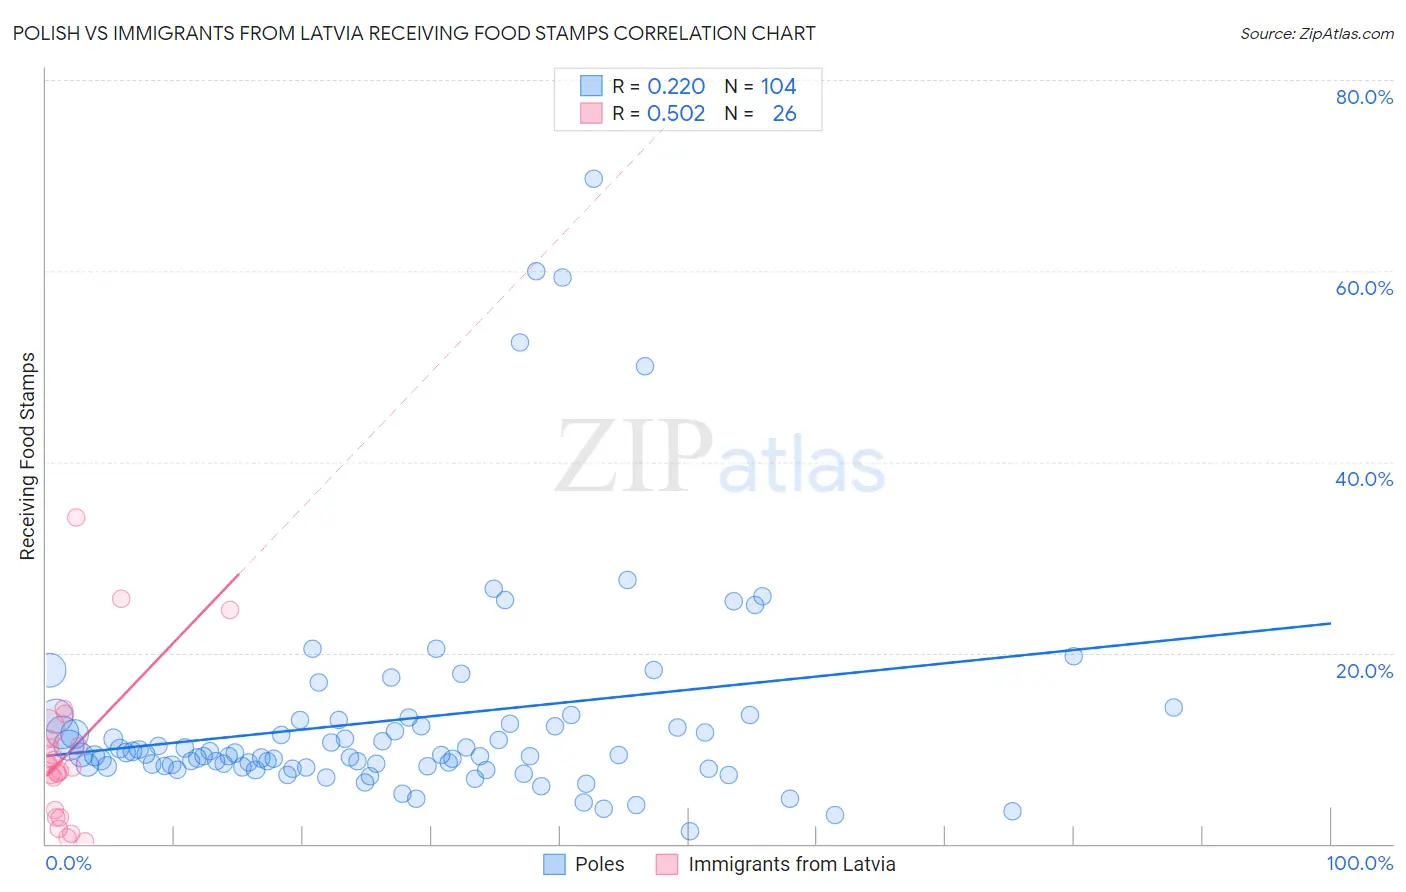
Polish vs Immigrants from Latvia Receiving Food Stamps Correlation Chart
The statistical analysis conducted on geographies consisting of 556,985,146 people shows a weak positive correlation between the proportion of Poles and percentage of population receiving government assistance and/or food stamps in the United States with a correlation coefficient (R) of 0.220 and weighted average of 10.0%. Similarly, the statistical analysis conducted on geographies consisting of 113,573,789 people shows a substantial positive correlation between the proportion of Immigrants from Latvia and percentage of population receiving government assistance and/or food stamps in the United States with a correlation coefficient (R) of 0.502 and weighted average of 10.3%, a difference of 3.7%.
Receiving Food Stamps Correlation Summary
| Measurement | Polish | Immigrants from Latvia |
| Minimum | 1.3% | 0.20% |
| Maximum | 69.7% | 34.2% |
| Range | 68.4% | 34.0% |
| Mean | 13.0% | 9.5% |
| Median | 9.3% | 8.1% |
| Interquartile 25% (IQ1) | 8.1% | 3.5% |
| Interquartile 75% (IQ3) | 12.7% | 11.0% |
| Interquartile Range (IQR) | 4.6% | 7.5% |
| Standard Deviation (Sample) | 11.6% | 8.0% |
| Standard Deviation (Population) | 11.5% | 7.8% |
Similar Demographics by Receiving Food Stamps
Demographics Similar to Poles by Receiving Food Stamps
In terms of receiving food stamps, the demographic groups most similar to Poles are Laotian (10.0%, a difference of 0.080%), South African (10.0%, a difference of 0.12%), Immigrants from England (10.0%, a difference of 0.14%), Immigrants from North Macedonia (10.0%, a difference of 0.16%), and Immigrants from Croatia (10.0%, a difference of 0.25%).
| Demographics | Rating | Rank | Receiving Food Stamps |
| Macedonians | 98.9 /100 | #73 | Exceptional 9.9% |
| New Zealanders | 98.8 /100 | #74 | Exceptional 9.9% |
| Immigrants | Zimbabwe | 98.7 /100 | #75 | Exceptional 9.9% |
| Immigrants | Croatia | 98.7 /100 | #76 | Exceptional 10.0% |
| Immigrants | North Macedonia | 98.7 /100 | #77 | Exceptional 10.0% |
| South Africans | 98.7 /100 | #78 | Exceptional 10.0% |
| Laotians | 98.7 /100 | #79 | Exceptional 10.0% |
| Poles | 98.6 /100 | #80 | Exceptional 10.0% |
| Immigrants | England | 98.6 /100 | #81 | Exceptional 10.0% |
| Austrians | 98.6 /100 | #82 | Exceptional 10.0% |
| Dutch | 98.6 /100 | #83 | Exceptional 10.0% |
| Immigrants | Israel | 98.5 /100 | #84 | Exceptional 10.0% |
| Immigrants | Romania | 98.5 /100 | #85 | Exceptional 10.0% |
| Immigrants | Norway | 98.4 /100 | #86 | Exceptional 10.0% |
| Egyptians | 98.4 /100 | #87 | Exceptional 10.0% |
Demographics Similar to Immigrants from Latvia by Receiving Food Stamps
In terms of receiving food stamps, the demographic groups most similar to Immigrants from Latvia are Immigrants from Hungary (10.3%, a difference of 0.010%), Immigrants from Europe (10.3%, a difference of 0.10%), Immigrants from Western Europe (10.3%, a difference of 0.18%), Palestinian (10.3%, a difference of 0.18%), and Serbian (10.3%, a difference of 0.31%).
| Demographics | Rating | Rank | Receiving Food Stamps |
| Welsh | 97.3 /100 | #96 | Exceptional 10.3% |
| Czechoslovakians | 97.2 /100 | #97 | Exceptional 10.3% |
| Immigrants | Egypt | 97.1 /100 | #98 | Exceptional 10.3% |
| Serbians | 97.0 /100 | #99 | Exceptional 10.3% |
| Immigrants | Western Europe | 96.9 /100 | #100 | Exceptional 10.3% |
| Palestinians | 96.9 /100 | #101 | Exceptional 10.3% |
| Immigrants | Europe | 96.8 /100 | #102 | Exceptional 10.3% |
| Immigrants | Latvia | 96.8 /100 | #103 | Exceptional 10.3% |
| Immigrants | Hungary | 96.7 /100 | #104 | Exceptional 10.3% |
| Immigrants | Malaysia | 96.5 /100 | #105 | Exceptional 10.4% |
| Immigrants | Italy | 96.4 /100 | #106 | Exceptional 10.4% |
| Koreans | 96.3 /100 | #107 | Exceptional 10.4% |
| Carpatho Rusyns | 96.2 /100 | #108 | Exceptional 10.4% |
| Immigrants | Pakistan | 96.2 /100 | #109 | Exceptional 10.4% |
| Pakistanis | 95.9 /100 | #110 | Exceptional 10.4% |