Immigrants from Guyana vs Alaskan Athabascan Receiving Food Stamps
COMPARE
Immigrants from Guyana
Alaskan Athabascan
Receiving Food Stamps
Receiving Food Stamps Comparison
Immigrants from Guyana
Alaskan Athabascans
16.9%
RECEIVING FOOD STAMPS
0.0/ 100
METRIC RATING
314th/ 347
METRIC RANK
14.7%
RECEIVING FOOD STAMPS
0.1/ 100
METRIC RATING
273rd/ 347
METRIC RANK
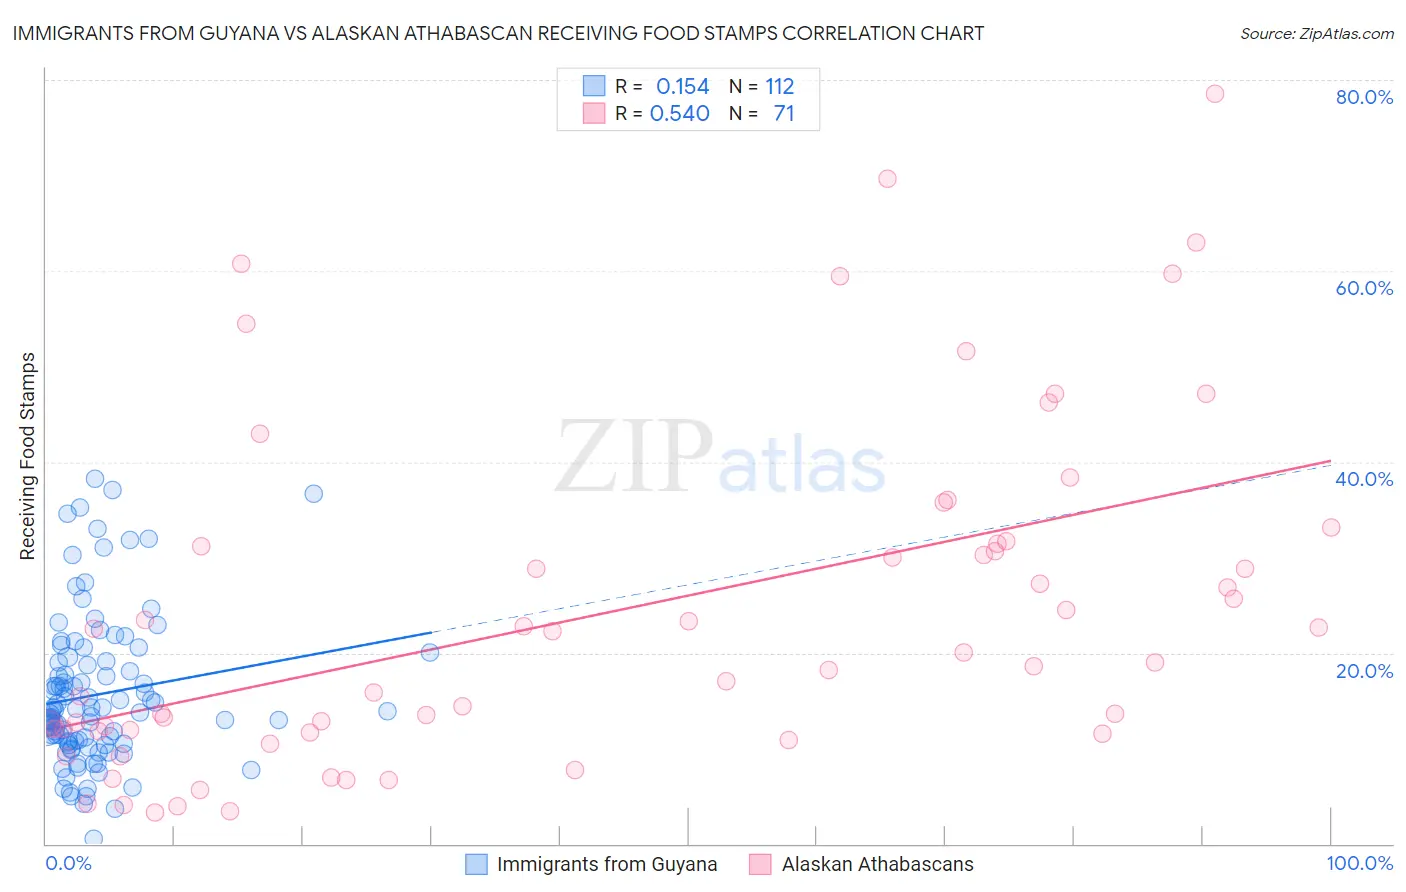
Immigrants from Guyana vs Alaskan Athabascan Receiving Food Stamps Correlation Chart
The statistical analysis conducted on geographies consisting of 183,583,231 people shows a poor positive correlation between the proportion of Immigrants from Guyana and percentage of population receiving government assistance and/or food stamps in the United States with a correlation coefficient (R) of 0.154 and weighted average of 16.9%. Similarly, the statistical analysis conducted on geographies consisting of 45,801,504 people shows a substantial positive correlation between the proportion of Alaskan Athabascans and percentage of population receiving government assistance and/or food stamps in the United States with a correlation coefficient (R) of 0.540 and weighted average of 14.7%, a difference of 15.1%.
Receiving Food Stamps Correlation Summary
| Measurement | Immigrants from Guyana | Alaskan Athabascan |
| Minimum | 0.50% | 3.3% |
| Maximum | 38.2% | 78.5% |
| Range | 37.7% | 75.2% |
| Mean | 15.6% | 24.2% |
| Median | 14.0% | 19.0% |
| Interquartile 25% (IQ1) | 10.7% | 11.8% |
| Interquartile 75% (IQ3) | 19.1% | 31.4% |
| Interquartile Range (IQR) | 8.4% | 19.6% |
| Standard Deviation (Sample) | 7.8% | 17.7% |
| Standard Deviation (Population) | 7.7% | 17.5% |
Similar Demographics by Receiving Food Stamps
Demographics Similar to Immigrants from Guyana by Receiving Food Stamps
In terms of receiving food stamps, the demographic groups most similar to Immigrants from Guyana are Immigrants from Jamaica (16.9%, a difference of 0.17%), Sioux (16.8%, a difference of 0.45%), Bahamian (17.0%, a difference of 0.57%), Central American Indian (17.1%, a difference of 1.0%), and Guyanese (16.7%, a difference of 1.2%).
| Demographics | Rating | Rank | Receiving Food Stamps |
| Houma | 0.0 /100 | #307 | Tragic 16.5% |
| Barbadians | 0.0 /100 | #308 | Tragic 16.5% |
| U.S. Virgin Islanders | 0.0 /100 | #309 | Tragic 16.5% |
| Immigrants | Barbados | 0.0 /100 | #310 | Tragic 16.6% |
| Guyanese | 0.0 /100 | #311 | Tragic 16.7% |
| Sioux | 0.0 /100 | #312 | Tragic 16.8% |
| Immigrants | Jamaica | 0.0 /100 | #313 | Tragic 16.9% |
| Immigrants | Guyana | 0.0 /100 | #314 | Tragic 16.9% |
| Bahamians | 0.0 /100 | #315 | Tragic 17.0% |
| Central American Indians | 0.0 /100 | #316 | Tragic 17.1% |
| Blacks/African Americans | 0.0 /100 | #317 | Tragic 17.2% |
| Menominee | 0.0 /100 | #318 | Tragic 17.2% |
| Immigrants | St. Vincent and the Grenadines | 0.0 /100 | #319 | Tragic 17.2% |
| Immigrants | Nicaragua | 0.0 /100 | #320 | Tragic 17.2% |
| Natives/Alaskans | 0.0 /100 | #321 | Tragic 17.3% |
Demographics Similar to Alaskan Athabascans by Receiving Food Stamps
In terms of receiving food stamps, the demographic groups most similar to Alaskan Athabascans are Immigrants from Western Africa (14.7%, a difference of 0.020%), Chippewa (14.7%, a difference of 0.030%), Ute (14.7%, a difference of 0.10%), Immigrants from Guatemala (14.6%, a difference of 0.25%), and Mexican (14.6%, a difference of 0.35%).
| Demographics | Rating | Rank | Receiving Food Stamps |
| Cheyenne | 0.2 /100 | #266 | Tragic 14.3% |
| Dutch West Indians | 0.2 /100 | #267 | Tragic 14.3% |
| Guatemalans | 0.1 /100 | #268 | Tragic 14.4% |
| Nepalese | 0.1 /100 | #269 | Tragic 14.6% |
| Mexicans | 0.1 /100 | #270 | Tragic 14.6% |
| Immigrants | Guatemala | 0.1 /100 | #271 | Tragic 14.6% |
| Chippewa | 0.1 /100 | #272 | Tragic 14.7% |
| Alaskan Athabascans | 0.1 /100 | #273 | Tragic 14.7% |
| Immigrants | Western Africa | 0.1 /100 | #274 | Tragic 14.7% |
| Ute | 0.1 /100 | #275 | Tragic 14.7% |
| Liberians | 0.1 /100 | #276 | Tragic 14.8% |
| Seminole | 0.1 /100 | #277 | Tragic 14.8% |
| Belizeans | 0.1 /100 | #278 | Tragic 14.8% |
| Kiowa | 0.0 /100 | #279 | Tragic 14.9% |
| Ecuadorians | 0.0 /100 | #280 | Tragic 14.9% |