Houma vs Alaskan Athabascan Receiving Food Stamps
COMPARE
Houma
Alaskan Athabascan
Receiving Food Stamps
Receiving Food Stamps Comparison
Houma
Alaskan Athabascans
16.5%
RECEIVING FOOD STAMPS
0.0/ 100
METRIC RATING
307th/ 347
METRIC RANK
14.7%
RECEIVING FOOD STAMPS
0.1/ 100
METRIC RATING
273rd/ 347
METRIC RANK
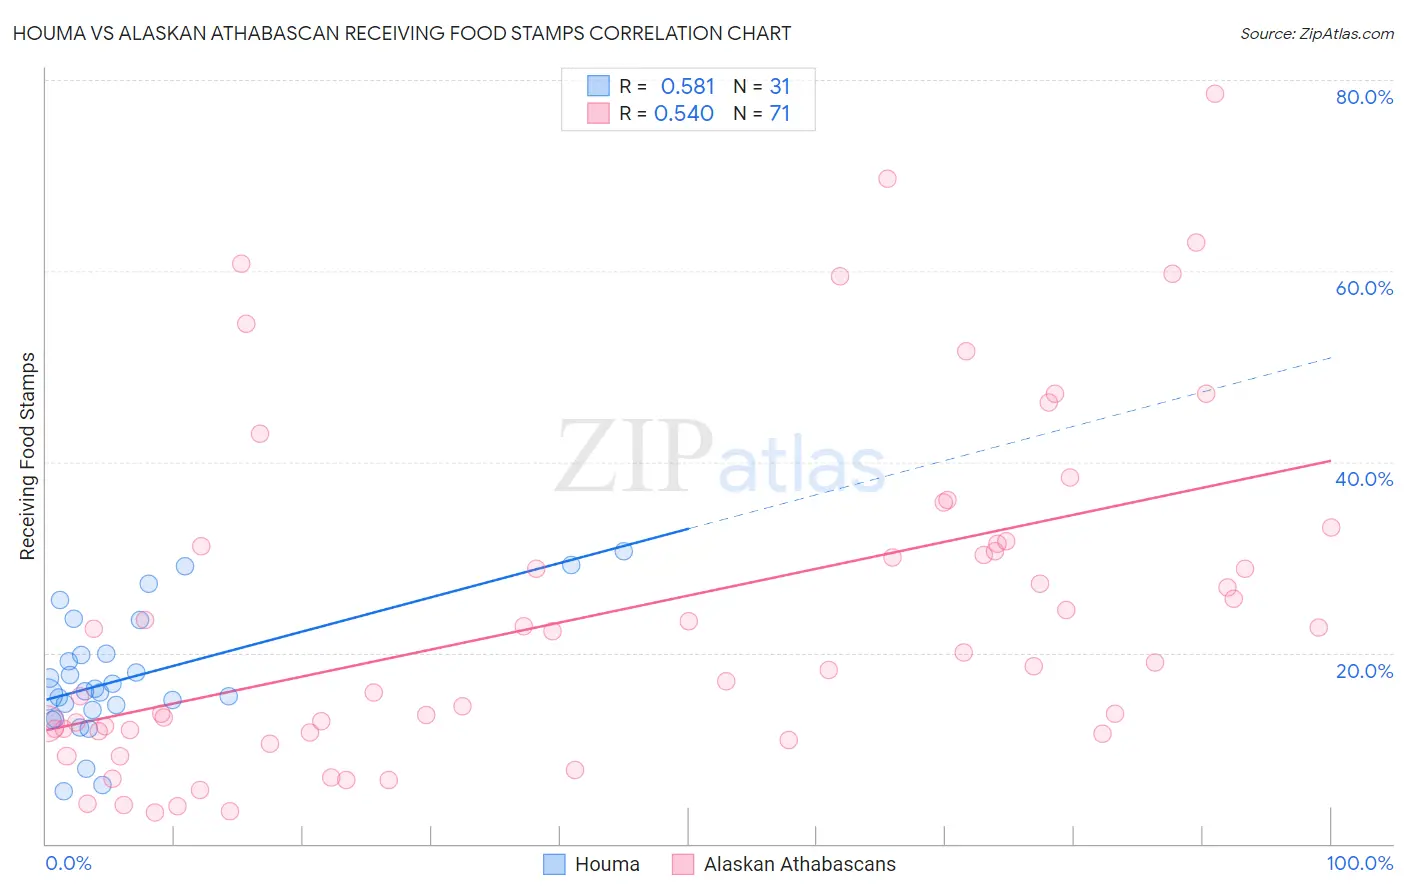
Houma vs Alaskan Athabascan Receiving Food Stamps Correlation Chart
The statistical analysis conducted on geographies consisting of 36,773,946 people shows a substantial positive correlation between the proportion of Houma and percentage of population receiving government assistance and/or food stamps in the United States with a correlation coefficient (R) of 0.581 and weighted average of 16.5%. Similarly, the statistical analysis conducted on geographies consisting of 45,801,504 people shows a substantial positive correlation between the proportion of Alaskan Athabascans and percentage of population receiving government assistance and/or food stamps in the United States with a correlation coefficient (R) of 0.540 and weighted average of 14.7%, a difference of 12.0%.
Receiving Food Stamps Correlation Summary
| Measurement | Houma | Alaskan Athabascan |
| Minimum | 5.5% | 3.3% |
| Maximum | 30.6% | 78.5% |
| Range | 25.1% | 75.2% |
| Mean | 17.4% | 24.2% |
| Median | 16.0% | 19.0% |
| Interquartile 25% (IQ1) | 14.0% | 11.8% |
| Interquartile 75% (IQ3) | 19.9% | 31.4% |
| Interquartile Range (IQR) | 5.9% | 19.6% |
| Standard Deviation (Sample) | 6.3% | 17.7% |
| Standard Deviation (Population) | 6.2% | 17.5% |
Similar Demographics by Receiving Food Stamps
Demographics Similar to Houma by Receiving Food Stamps
In terms of receiving food stamps, the demographic groups most similar to Houma are Barbadian (16.5%, a difference of 0.26%), Jamaican (16.4%, a difference of 0.29%), Immigrants from the Azores (16.4%, a difference of 0.35%), U.S. Virgin Islander (16.5%, a difference of 0.50%), and Immigrants from Barbados (16.6%, a difference of 1.1%).
| Demographics | Rating | Rank | Receiving Food Stamps |
| Immigrants | Bangladesh | 0.0 /100 | #300 | Tragic 15.9% |
| Trinidadians and Tobagonians | 0.0 /100 | #301 | Tragic 16.0% |
| Immigrants | West Indies | 0.0 /100 | #302 | Tragic 16.1% |
| Nicaraguans | 0.0 /100 | #303 | Tragic 16.1% |
| West Indians | 0.0 /100 | #304 | Tragic 16.3% |
| Immigrants | Azores | 0.0 /100 | #305 | Tragic 16.4% |
| Jamaicans | 0.0 /100 | #306 | Tragic 16.4% |
| Houma | 0.0 /100 | #307 | Tragic 16.5% |
| Barbadians | 0.0 /100 | #308 | Tragic 16.5% |
| U.S. Virgin Islanders | 0.0 /100 | #309 | Tragic 16.5% |
| Immigrants | Barbados | 0.0 /100 | #310 | Tragic 16.6% |
| Guyanese | 0.0 /100 | #311 | Tragic 16.7% |
| Sioux | 0.0 /100 | #312 | Tragic 16.8% |
| Immigrants | Jamaica | 0.0 /100 | #313 | Tragic 16.9% |
| Immigrants | Guyana | 0.0 /100 | #314 | Tragic 16.9% |
Demographics Similar to Alaskan Athabascans by Receiving Food Stamps
In terms of receiving food stamps, the demographic groups most similar to Alaskan Athabascans are Immigrants from Western Africa (14.7%, a difference of 0.020%), Chippewa (14.7%, a difference of 0.030%), Ute (14.7%, a difference of 0.10%), Immigrants from Guatemala (14.6%, a difference of 0.25%), and Mexican (14.6%, a difference of 0.35%).
| Demographics | Rating | Rank | Receiving Food Stamps |
| Cheyenne | 0.2 /100 | #266 | Tragic 14.3% |
| Dutch West Indians | 0.2 /100 | #267 | Tragic 14.3% |
| Guatemalans | 0.1 /100 | #268 | Tragic 14.4% |
| Nepalese | 0.1 /100 | #269 | Tragic 14.6% |
| Mexicans | 0.1 /100 | #270 | Tragic 14.6% |
| Immigrants | Guatemala | 0.1 /100 | #271 | Tragic 14.6% |
| Chippewa | 0.1 /100 | #272 | Tragic 14.7% |
| Alaskan Athabascans | 0.1 /100 | #273 | Tragic 14.7% |
| Immigrants | Western Africa | 0.1 /100 | #274 | Tragic 14.7% |
| Ute | 0.1 /100 | #275 | Tragic 14.7% |
| Liberians | 0.1 /100 | #276 | Tragic 14.8% |
| Seminole | 0.1 /100 | #277 | Tragic 14.8% |
| Belizeans | 0.1 /100 | #278 | Tragic 14.8% |
| Kiowa | 0.0 /100 | #279 | Tragic 14.9% |
| Ecuadorians | 0.0 /100 | #280 | Tragic 14.9% |