Nigerian vs Immigrants Single Mother Poverty
COMPARE
Nigerian
Immigrants
Single Mother Poverty
Single Mother Poverty Comparison
Nigerians
Immigrants
29.3%
SINGLE MOTHER POVERTY
38.0/ 100
METRIC RATING
184th/ 347
METRIC RANK
29.7%
SINGLE MOTHER POVERTY
16.6/ 100
METRIC RATING
204th/ 347
METRIC RANK
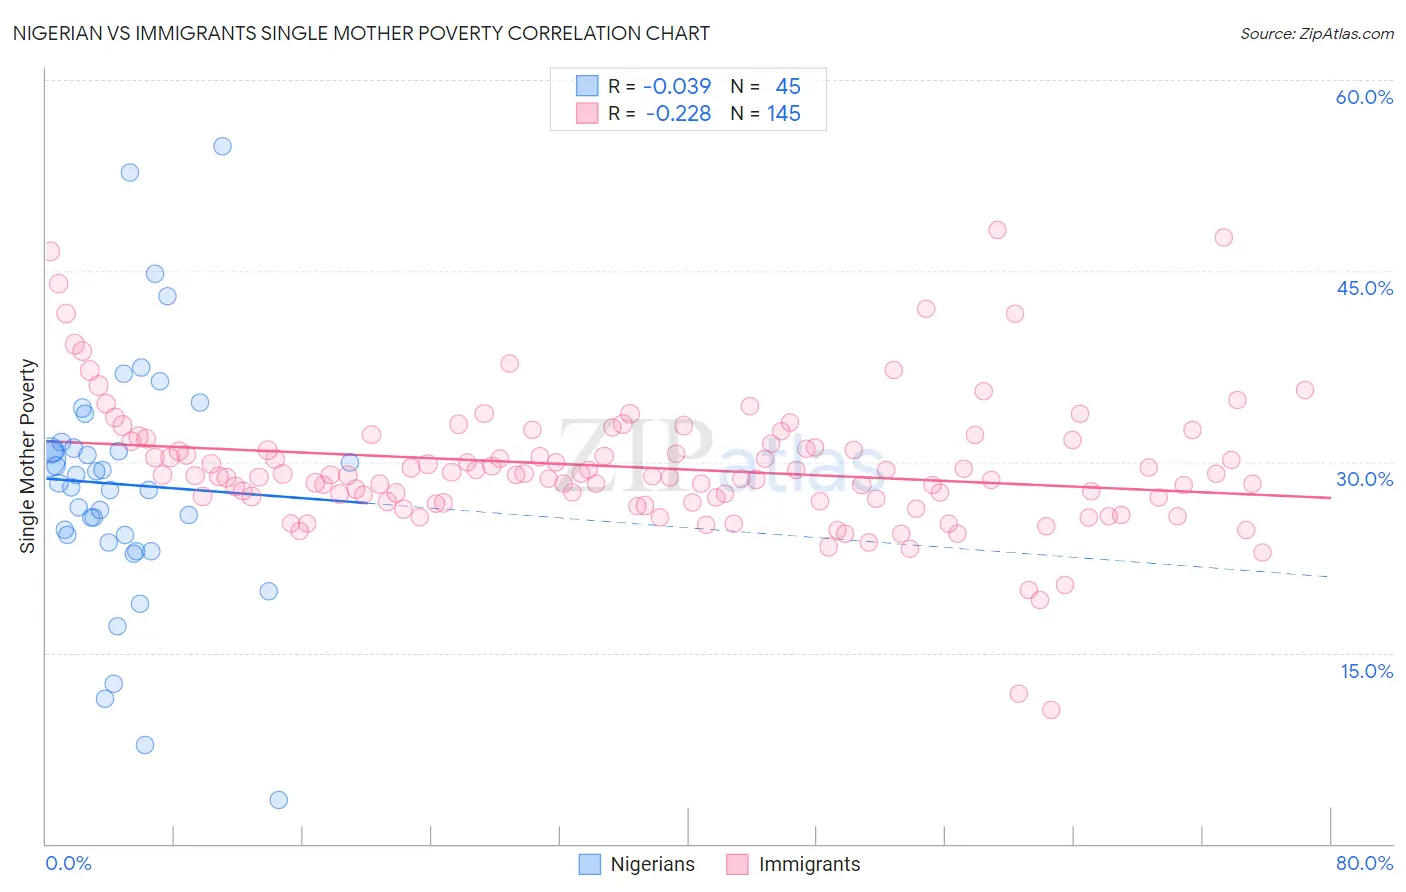
Nigerian vs Immigrants Single Mother Poverty Correlation Chart
The statistical analysis conducted on geographies consisting of 328,233,432 people shows no correlation between the proportion of Nigerians and poverty level among single mothers in the United States with a correlation coefficient (R) of -0.039 and weighted average of 29.3%. Similarly, the statistical analysis conducted on geographies consisting of 548,894,561 people shows a weak negative correlation between the proportion of Immigrants and poverty level among single mothers in the United States with a correlation coefficient (R) of -0.228 and weighted average of 29.7%, a difference of 1.3%.
Single Mother Poverty Correlation Summary
| Measurement | Nigerian | Immigrants |
| Minimum | 3.4% | 10.6% |
| Maximum | 54.8% | 48.3% |
| Range | 51.3% | 37.7% |
| Mean | 28.2% | 29.6% |
| Median | 28.3% | 29.0% |
| Interquartile 25% (IQ1) | 24.0% | 27.0% |
| Interquartile 75% (IQ3) | 31.3% | 31.7% |
| Interquartile Range (IQR) | 7.4% | 4.7% |
| Standard Deviation (Sample) | 9.8% | 5.3% |
| Standard Deviation (Population) | 9.7% | 5.3% |
Demographics Similar to Nigerians and Immigrants by Single Mother Poverty
In terms of single mother poverty, the demographic groups most similar to Nigerians are Ghanaian (29.4%, a difference of 0.060%), Yugoslavian (29.4%, a difference of 0.10%), Lebanese (29.4%, a difference of 0.29%), Guamanian/Chamorro (29.4%, a difference of 0.33%), and Immigrants from Africa (29.4%, a difference of 0.33%). Similarly, the demographic groups most similar to Immigrants are Swiss (29.7%, a difference of 0.050%), Malaysian (29.7%, a difference of 0.070%), Belgian (29.7%, a difference of 0.18%), Panamanian (29.6%, a difference of 0.27%), and Cuban (29.6%, a difference of 0.33%).
| Demographics | Rating | Rank | Single Mother Poverty |
| Nigerians | 38.0 /100 | #184 | Fair 29.3% |
| Ghanaians | 36.8 /100 | #185 | Fair 29.4% |
| Yugoslavians | 36.0 /100 | #186 | Fair 29.4% |
| Lebanese | 32.5 /100 | #187 | Fair 29.4% |
| Guamanians/Chamorros | 31.8 /100 | #188 | Fair 29.4% |
| Immigrants | Africa | 31.6 /100 | #189 | Fair 29.4% |
| Immigrants | Germany | 30.4 /100 | #190 | Fair 29.5% |
| Immigrants | Trinidad and Tobago | 29.2 /100 | #191 | Fair 29.5% |
| Moroccans | 28.6 /100 | #192 | Fair 29.5% |
| Basques | 28.3 /100 | #193 | Fair 29.5% |
| Icelanders | 26.1 /100 | #194 | Fair 29.5% |
| Slavs | 24.5 /100 | #195 | Fair 29.6% |
| Spanish American Indians | 23.4 /100 | #196 | Fair 29.6% |
| Immigrants | Jamaica | 22.0 /100 | #197 | Fair 29.6% |
| Trinidadians and Tobagonians | 21.7 /100 | #198 | Fair 29.6% |
| Cubans | 20.8 /100 | #199 | Fair 29.6% |
| Panamanians | 20.0 /100 | #200 | Fair 29.6% |
| Belgians | 18.8 /100 | #201 | Poor 29.7% |
| Malaysians | 17.4 /100 | #202 | Poor 29.7% |
| Swiss | 17.2 /100 | #203 | Poor 29.7% |
| Immigrants | Immigrants | 16.6 /100 | #204 | Poor 29.7% |