Pima vs Immigrants In Labor Force | Age 25-29
COMPARE
Pima
Immigrants
In Labor Force | Age 25-29
In Labor Force | Age 25-29 Comparison
Pima
Immigrants
74.3%
IN LABOR FORCE | AGE 25-29
0.0/ 100
METRIC RATING
346th/ 347
METRIC RANK
83.9%
IN LABOR FORCE | AGE 25-29
0.9/ 100
METRIC RATING
237th/ 347
METRIC RANK
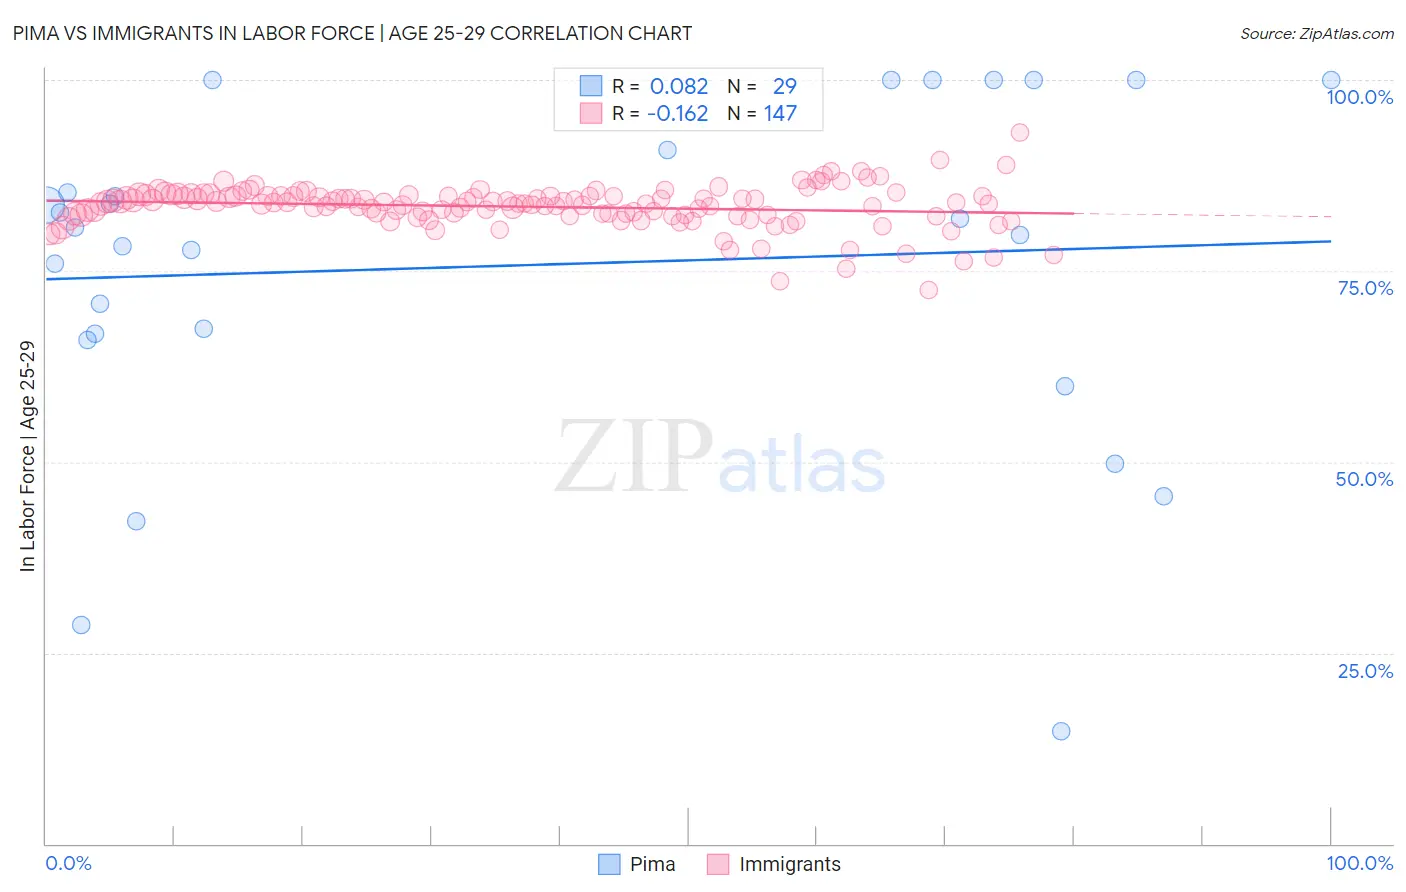
Pima vs Immigrants In Labor Force | Age 25-29 Correlation Chart
The statistical analysis conducted on geographies consisting of 61,533,053 people shows a slight positive correlation between the proportion of Pima and labor force participation rate among population between the ages 25 and 29 in the United States with a correlation coefficient (R) of 0.082 and weighted average of 74.3%. Similarly, the statistical analysis conducted on geographies consisting of 576,264,876 people shows a poor negative correlation between the proportion of Immigrants and labor force participation rate among population between the ages 25 and 29 in the United States with a correlation coefficient (R) of -0.162 and weighted average of 83.9%, a difference of 13.0%.
In Labor Force | Age 25-29 Correlation Summary
| Measurement | Pima | Immigrants |
| Minimum | 14.8% | 72.6% |
| Maximum | 100.0% | 93.2% |
| Range | 85.2% | 20.6% |
| Mean | 75.8% | 83.4% |
| Median | 80.7% | 83.9% |
| Interquartile 25% (IQ1) | 66.3% | 82.3% |
| Interquartile 75% (IQ3) | 95.4% | 84.8% |
| Interquartile Range (IQR) | 29.1% | 2.5% |
| Standard Deviation (Sample) | 22.3% | 2.8% |
| Standard Deviation (Population) | 21.9% | 2.8% |
Similar Demographics by In Labor Force | Age 25-29
Demographics Similar to Pima by In Labor Force | Age 25-29
In terms of in labor force | age 25-29, the demographic groups most similar to Pima are Navajo (74.6%, a difference of 0.48%), Yup'ik (73.1%, a difference of 1.7%), Hopi (76.5%, a difference of 3.0%), Arapaho (76.6%, a difference of 3.1%), and Pueblo (77.5%, a difference of 4.3%).
| Demographics | Rating | Rank | In Labor Force | Age 25-29 |
| Sioux | 0.0 /100 | #333 | Tragic 79.7% |
| Yuman | 0.0 /100 | #334 | Tragic 79.3% |
| Natives/Alaskans | 0.0 /100 | #335 | Tragic 79.3% |
| Apache | 0.0 /100 | #336 | Tragic 79.2% |
| Crow | 0.0 /100 | #337 | Tragic 78.6% |
| Lumbee | 0.0 /100 | #338 | Tragic 78.3% |
| Immigrants | Yemen | 0.0 /100 | #339 | Tragic 78.2% |
| Paiute | 0.0 /100 | #340 | Tragic 78.1% |
| Tohono O'odham | 0.0 /100 | #341 | Tragic 77.5% |
| Pueblo | 0.0 /100 | #342 | Tragic 77.5% |
| Arapaho | 0.0 /100 | #343 | Tragic 76.6% |
| Hopi | 0.0 /100 | #344 | Tragic 76.5% |
| Navajo | 0.0 /100 | #345 | Tragic 74.6% |
| Pima | 0.0 /100 | #346 | Tragic 74.3% |
| Yup'ik | 0.0 /100 | #347 | Tragic 73.1% |
Demographics Similar to Immigrants by In Labor Force | Age 25-29
In terms of in labor force | age 25-29, the demographic groups most similar to Immigrants are Guamanian/Chamorro (83.9%, a difference of 0.0%), Iraqi (83.9%, a difference of 0.010%), Barbadian (83.9%, a difference of 0.030%), Immigrants from Uzbekistan (83.9%, a difference of 0.030%), and Jamaican (83.9%, a difference of 0.030%).
| Demographics | Rating | Rank | In Labor Force | Age 25-29 |
| Whites/Caucasians | 4.8 /100 | #230 | Tragic 84.2% |
| Immigrants | Philippines | 4.7 /100 | #231 | Tragic 84.2% |
| Panamanians | 4.5 /100 | #232 | Tragic 84.2% |
| Immigrants | Western Asia | 2.7 /100 | #233 | Tragic 84.1% |
| Barbadians | 1.0 /100 | #234 | Tragic 83.9% |
| Iraqis | 0.9 /100 | #235 | Tragic 83.9% |
| Guamanians/Chamorros | 0.9 /100 | #236 | Tragic 83.9% |
| Immigrants | Immigrants | 0.9 /100 | #237 | Tragic 83.9% |
| Immigrants | Uzbekistan | 0.8 /100 | #238 | Tragic 83.9% |
| Jamaicans | 0.8 /100 | #239 | Tragic 83.9% |
| Trinidadians and Tobagonians | 0.7 /100 | #240 | Tragic 83.9% |
| Alsatians | 0.7 /100 | #241 | Tragic 83.9% |
| U.S. Virgin Islanders | 0.6 /100 | #242 | Tragic 83.8% |
| Salvadorans | 0.5 /100 | #243 | Tragic 83.8% |
| Immigrants | Jamaica | 0.4 /100 | #244 | Tragic 83.8% |